

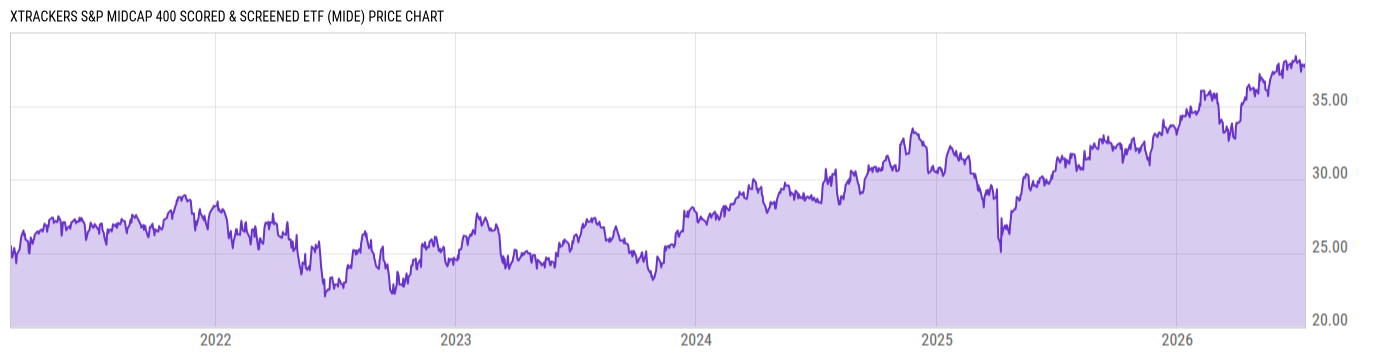
Xtrackers S&P MidCap 400 Scored & Screened ETF (MIDE)
37.83
+0.17
(+0.45%)
USD |
NYSEARCA |
Jul 14, 16:00
Price Chart
Key Stats
| Net Expense Ratio | Discount or Premium to NAV | Total Assets Under Management | 30-Day Average Daily Volume |
|---|---|---|---|
| 0.15% | 0.06% | 3.402M | 894.33 |
| Weighted Average Dividend Yield | Turnover Ratio (Generic) | 1 Year Fund Level Flows | Max Drawdown (Since Inception) |
| 1.33% | 28.00% | -3.000M |
Basic Info
| Investment Strategy | |
| The Fund seeks investment results that correspond generally to the performance of the S&P MidCap 400 ESG Index, which provides exposure to companies with high ESG performance relative to their sector peers. The fund will invest at least 80% of its total assets in component securities of the Underlying Index. |
| General | |
| Security Type | Exchange-Traded Fund |
| Equity Style | Small Cap Core |
| Broad Asset Class | US Equity |
| Broad Category | Equity |
| Global Peer Group | Equity US Sm&Mid Cap |
| Peer Group | Small-Cap Core Funds |
| Global Macro | Equity North America |
| US Macro | Small-Cap Funds |
| YCharts Categorization | -- |
| YCharts Benchmark | -- |
| Prospectus Objective | Mid-Cap Funds |
| Fund Owner Firm Name | DWS |
| Broad Asset Class Benchmark Index | |
| ^SPXTR | 100.0% |
Performance Versus Peer Group
Annual Total Returns Versus Peers
As of July 15, 2026.
Asset Allocation
As of May 31, 2026.
| Type | % Net |
|---|---|
| Cash | -0.12% |
| Stock | 98.64% |
| Bond | 0.35% |
| Convertible | 0.00% |
| Preferred | 0.00% |
| Other | 1.13% |
Basic Info
| Investment Strategy | |
| The Fund seeks investment results that correspond generally to the performance of the S&P MidCap 400 ESG Index, which provides exposure to companies with high ESG performance relative to their sector peers. The fund will invest at least 80% of its total assets in component securities of the Underlying Index. |
| General | |
| Security Type | Exchange-Traded Fund |
| Equity Style | Small Cap Core |
| Broad Asset Class | US Equity |
| Broad Category | Equity |
| Global Peer Group | Equity US Sm&Mid Cap |
| Peer Group | Small-Cap Core Funds |
| Global Macro | Equity North America |
| US Macro | Small-Cap Funds |
| YCharts Categorization | -- |
| YCharts Benchmark | -- |
| Prospectus Objective | Mid-Cap Funds |
| Fund Owner Firm Name | DWS |
| Broad Asset Class Benchmark Index | |
| ^SPXTR | 100.0% |