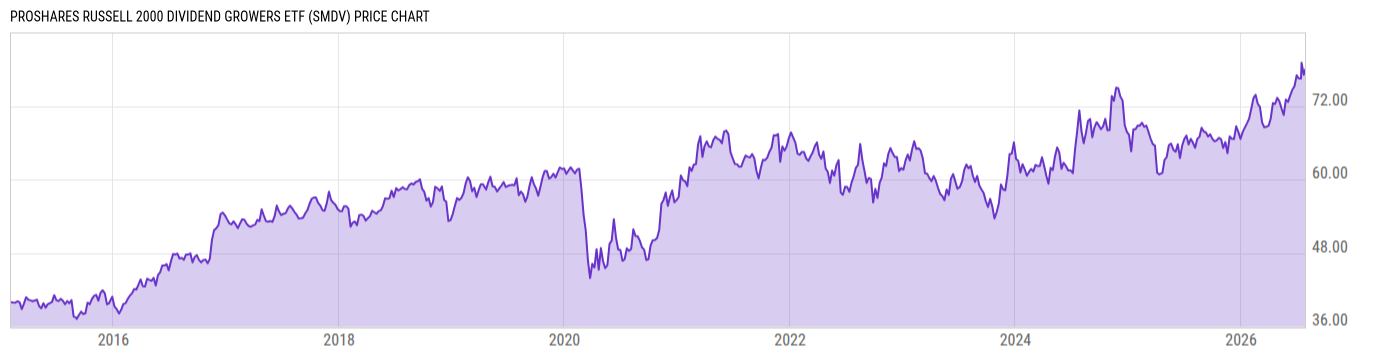
Key Stats

Expense Ratio Discount or Premium to NAV Total Assets Under Management 30-Day Average Daily Volume
0.40% -0.11% 827.50M 51620.10
Dividend Yield Turnover Ratio 1 Year Fund Level Flows Max Drawdown (All)
2.06% 58.00% 15.38M Upgrade

Basic Info

Investment Strategy
The investment seeks investment results, before fees and expenses, that track the performance of the Russell 2000 ® Dividend Growth Index (the "index"). Under normal circumstances, the fund will invest at least 80% of its total assets in component securities of the index. The index contains a minimum of 40 stocks, which are equally weighted. No single sector is allowed to comprise more than 30% of the index weight.
General
Security Type Exchange-Traded Fund
Equity Style Small Cap/Value
Fixed Income Style --
Broad Asset Class US Equity
Broad Category Equity
Category Name Small Blend
Category Index Russell 2000 TR USD
Global Category Name US Equity Small Cap
YCharts Categorization US Small Cap
YCharts Benchmark Russell 2000 Total Return (^RUTTR)
Prospectus Objective Growth
Fund Owner Firm Name ProShares
Prospectus Benchmark Index
Russell 2000 Dividend Growth TR USD 100.0%
Broad Asset Class Benchmark Index
^SPXTR 100.0%
Manager Tenure
Michael Neches 8.08 yrs
Devin Sullivan 4.84 yrs

Net Fund Flows Versus Category

View Net Fund Flows. Upgrade now.
1M
3M
6M
YTD
1Y
3Y
5Y
10Y
 
80.00B
60.00B
40.00B
20.00B
0
-20.00B
1 Month
% Rank: --
-- Category Low
-- Category High
1 Year
% Rank: 18
15.38M
-3.126B Category Low
3.556B Category High
3 Months
% Rank: --
-- Category Low
-- Category High
3 Years
% Rank: --
-- Category Low
-- Category High
6 Months
% Rank: --
-- Category Low
-- Category High
5 Years
% Rank: --
-- Category Low
-- Category High
YTD
% Rank: --
-- Category Low
-- Category High
10 Years
% Rank: --
-- Category Low
-- Category High
As of February 28, 2023

Performance Versus Category

 
20%
15%
10%
5%
0
View Category Returns. Upgrade now.
Name
1M
3M
YTD
1Y
3Y
5Y
10Y
15Y
Total Return (Price)
--
--
--
--
--
--
--
--
Total Return (NAV)
--
--
--
--
--
--
--
--
Category Rtn. (NAV)
--
--
--
--
--
--
--
--
% Rank in Cat (NAV)
--
--
--
--
--
--
--
--
As of March 17, 2023. Returns for periods of 1 year and above are annualized.

Annual Total Returns Versus Peers

Loading chart...
Name
2016
2017
2018
2019
2020
2021
2022
YTD
35.68%
4.62%
-0.60%
17.23%
-4.72%
18.98%
-5.88%
-3.03%
11.96%
21.83%
-4.38%
31.49%
18.40%
28.71%
-18.11%
2.41%
25.24%
10.11%
-10.97%
20.51%
14.92%
32.03%
-16.79%
-1.92%
31.44%
8.56%
-5.38%
22.36%
-17.33%
29.34%
-11.86%
-5.54%
20.65%
12.79%
-13.12%
22.20%
20.88%
18.68%
-21.93%
-5.29%
35.45%
3.61%
-12.32%
30.00%
5.13%
56.39%
-13.64%
-5.71%
As of March 17, 2023.

Fundamentals

General
Distribution Yield Upgrade
Dividend Yield TTM (3-20-23) 2.06%
30-Day SEC Yield --
7-Day SEC Yield --
Number of Holdings Upgrade
Stock
Weighted Average PE Ratio 17.81
Weighted Average Price to Sales Ratio Upgrade
Weighted Average Price to Book Ratio Upgrade
Weighted Median ROE Upgrade
Weighted Median ROA Upgrade
Forecasted Dividend Yield Upgrade
Forecasted PE Ratio Upgrade
Forecasted Price to Sales Ratio Upgrade
Forecasted Price to Book Ratio Upgrade
As of July 31, 2022

Growth Estimates

Forecasted 5 Yr Earnings Growth Upgrade
Forecasted Book Value Growth Upgrade
Forecasted Cash Flow Growth Upgrade
Forecasted Earnings Growth Upgrade
Forecasted Revenue Growth Upgrade
As of July 31, 2022

Asset Allocation

As of July 31, 2022.
Type % Net % Long % Short
Cash 0.00% Upgrade Upgrade
Stock 99.86% Upgrade Upgrade
Bond 0.00% Upgrade Upgrade
Convertible 0.00% Upgrade Upgrade
Preferred 0.00% Upgrade Upgrade
Other 0.14% Upgrade Upgrade

Top 10 Holdings

Name % Weight Price % Change
Franklin Electric Co Inc 1.20% 90.77 2.72%
Lindsay Corp 1.19% 143.24 3.78%
Badger Meter Inc 1.18% 117.58 2.71%
Worthington Industries Inc 1.13% 53.37 2.40%
Exponent Inc 1.12% 97.38 1.40%
Northwest Bancshares Inc 1.11% 12.65 1.04%
Federal Agricultural Mortgage Corp Class C 1.11% 127.14 0.79%
Insperity Inc 1.11% 118.57 1.92%
Washington Trust Bancorp Inc 1.09% 35.39 1.58%
Balchem Corp 1.09% 127.39 1.28%

Basic Info

Investment Strategy
The investment seeks investment results, before fees and expenses, that track the performance of the Russell 2000 ® Dividend Growth Index (the "index"). Under normal circumstances, the fund will invest at least 80% of its total assets in component securities of the index. The index contains a minimum of 40 stocks, which are equally weighted. No single sector is allowed to comprise more than 30% of the index weight.
General
Security Type Exchange-Traded Fund
Equity Style Small Cap/Value
Fixed Income Style --
Broad Asset Class US Equity
Broad Category Equity
Category Name Small Blend
Category Index Russell 2000 TR USD
Global Category Name US Equity Small Cap
YCharts Categorization US Small Cap
YCharts Benchmark Russell 2000 Total Return (^RUTTR)
Prospectus Objective Growth
Fund Owner Firm Name ProShares
Prospectus Benchmark Index
Russell 2000 Dividend Growth TR USD 100.0%
Broad Asset Class Benchmark Index
^SPXTR 100.0%
Manager Tenure
Michael Neches 8.08 yrs
Devin Sullivan 4.84 yrs

Fundamentals

General
Distribution Yield Upgrade
Dividend Yield TTM (3-20-23) 2.06%
30-Day SEC Yield --
7-Day SEC Yield --
Number of Holdings Upgrade
Stock
Weighted Average PE Ratio 17.81
Weighted Average Price to Sales Ratio Upgrade
Weighted Average Price to Book Ratio Upgrade
Weighted Median ROE Upgrade
Weighted Median ROA Upgrade
Forecasted Dividend Yield Upgrade
Forecasted PE Ratio Upgrade
Forecasted Price to Sales Ratio Upgrade
Forecasted Price to Book Ratio Upgrade
As of July 31, 2022

Growth Estimates

Forecasted 5 Yr Earnings Growth Upgrade
Forecasted Book Value Growth Upgrade
Forecasted Cash Flow Growth Upgrade
Forecasted Earnings Growth Upgrade
Forecasted Revenue Growth Upgrade
As of July 31, 2022

Fund Details

Key Dates
Inception Date 2/3/2015
Last Annual Report Date 5/31/2022
Last Prospectus Date 10/1/2022
Attributes
Index Fund Yes
Inverse Fund No
Leveraged Fund No
Fund of Funds No
Currency Hedged Fund No
Synthetic Replication Fund No
Has Dividend Investment Plan No
Socially Responsible Fund No

Top Portfolio Holders

0 of 0