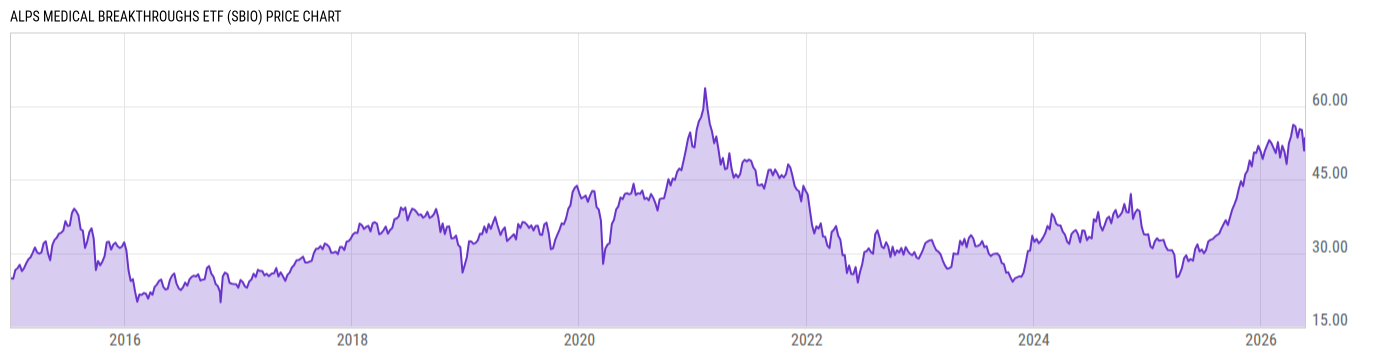
ALPS Medical Breakthroughs ETF (SBIO)
26.62
+0.12
(+0.46%)
USD |
NYSEARCA |
Mar 24, 16:00
26.47
-0.15
(-0.56%)
After-Hours: 20:00
Key Stats
Expense Ratio | Discount or Premium to NAV | Total Assets Under Management | 30-Day Average Daily Volume |
---|---|---|---|
0.50% | 0.25% | 97.38M | 10865.03 |
Dividend Yield | Turnover Ratio | 1 Year Fund Level Flows | Max Drawdown (All) |
0.00% | 88.00% | -17.02M | Upgrade |
Basic Info
Investment Strategy | |
The investment seeks investment results that correspond (before fees and expenses) generally to the performance of its underlying index, the S-Network® Medical Breakthroughs Index. The fund employs a "passive management" - or indexing - investment approach designed to track the performance of the underlying index. It will normally invest at least 80% of its net assets in securities that comprise the underlying index. The underlying index is comprised of small and mid-cap stocks of biotechnology companies that have one or more drugs in either Phase II or Phase III of the U.S. Food and Drug Administration clinical trials. |
General | |
Security Type | Exchange-Traded Fund |
Equity Style | Small Cap/Growth |
Fixed Income Style | -- |
Broad Asset Class | Sector Equity |
Broad Category | Equity |
Category Name | Health |
Category Index | S&P 1500 Health Care TR |
Global Category Name | Healthcare Sector Equity |
YCharts Categorization | Healthcare Equity |
YCharts Benchmark | S&P 1500 Health Care (Sector) Total Return (^SP15HCSTR) |
Prospectus Objective | Specialty - Health |
Fund Owner Firm Name | ALPS |
Prospectus Benchmark Index | |
S-Network Medical Breakthroughs TR USD | 100.0% |
Broad Asset Class Benchmark Index | |
^MSWNTR | 100.0% |
Manager Tenure | |
Ryan Mischker | 7.92 yrs |
Andrew Hicks | 6.92 yrs |
Net Fund Flows Versus Category
1 Month
% Rank:
--
--
Category Low
--
Category High
1 Year
% Rank:
47
-17.02M
-2.719B
Category Low
6.230B
Category High
3 Months
% Rank:
--
--
Category Low
--
Category High
3 Years
% Rank:
--
--
Category Low
--
Category High
6 Months
% Rank:
--
--
Category Low
--
Category High
5 Years
% Rank:
--
--
Category Low
--
Category High
YTD
% Rank:
--
--
Category Low
--
Category High
10 Years
% Rank:
--
--
Category Low
--
Category High
As of February 28, 2023
Risk
Performance Versus Category
As of March 24, 2023. Returns for periods of 1 year and above are annualized.
Annual Total Returns Versus Peers
As of March 24, 2023.
Asset Allocation
Top 10 Holdings
Name | % Weight | Price | % Change |
---|---|---|---|
Roivant Sciences Ltd Ordinary Shares | 3.67% | 6.92 | -1.00% |
Prometheus Biosciences Inc | 3.56% | 107.30 | 0.31% |
Alkermes PLC | 3.04% | 26.49 | 2.87% |
Cerevel Therapeutics Holdings Inc Ordinary Shares | 2.57% | 23.43 | 0.00% |
IVERIC bio Inc | 2.32% | 24.17 | 1.94% |
Zai Lab Ltd ADR Repr 1 Shs | 2.31% | 31.70 | 0.76% |
Cytokinetics Inc | 2.22% | 33.36 | -0.80% |
Denali Therapeutics Inc | 2.19% | 22.90 | -0.04% |
Vaxcyte Inc Ordinary Shares | 2.12% | 37.84 | -0.11% |
Vir Biotechnology Inc | 2.10% | 22.49 | 1.03% |
News
Headline
Wire
Time (ET)
PR Newswire
06/30 08:51
Basic Info
Investment Strategy | |
The investment seeks investment results that correspond (before fees and expenses) generally to the performance of its underlying index, the S-Network® Medical Breakthroughs Index. The fund employs a "passive management" - or indexing - investment approach designed to track the performance of the underlying index. It will normally invest at least 80% of its net assets in securities that comprise the underlying index. The underlying index is comprised of small and mid-cap stocks of biotechnology companies that have one or more drugs in either Phase II or Phase III of the U.S. Food and Drug Administration clinical trials. |
General | |
Security Type | Exchange-Traded Fund |
Equity Style | Small Cap/Growth |
Fixed Income Style | -- |
Broad Asset Class | Sector Equity |
Broad Category | Equity |
Category Name | Health |
Category Index | S&P 1500 Health Care TR |
Global Category Name | Healthcare Sector Equity |
YCharts Categorization | Healthcare Equity |
YCharts Benchmark | S&P 1500 Health Care (Sector) Total Return (^SP15HCSTR) |
Prospectus Objective | Specialty - Health |
Fund Owner Firm Name | ALPS |
Prospectus Benchmark Index | |
S-Network Medical Breakthroughs TR USD | 100.0% |
Broad Asset Class Benchmark Index | |
^MSWNTR | 100.0% |
Manager Tenure | |
Ryan Mischker | 7.92 yrs |
Andrew Hicks | 6.92 yrs |
Fundamentals
General | |
Distribution Yield | Upgrade |
Dividend Yield TTM (3-24-23) | 0.00% |
30-Day SEC Yield (3-23-23) | Upgrade |
7-Day SEC Yield | -- |
Number of Holdings | Upgrade |
Stock | |
Weighted Average PE Ratio | -- |
Weighted Average Price to Sales Ratio | Upgrade |
Weighted Average Price to Book Ratio | Upgrade |
Weighted Median ROE | Upgrade |
Weighted Median ROA | Upgrade |
Forecasted Dividend Yield | Upgrade |
Forecasted PE Ratio | Upgrade |
Forecasted Price to Sales Ratio | Upgrade |
Forecasted Price to Book Ratio | Upgrade |
As of March 24, 2023
Fund Details
Key Dates | |
Inception Date | 12/30/2014 |
Last Annual Report Date | 11/30/2022 |
Last Prospectus Date | 3/31/2022 |
Attributes | |
Index Fund |
|
Inverse Fund | No |
Leveraged Fund | No |
Fund of Funds | No |
Currency Hedged Fund | No |
Synthetic Replication Fund | No |
Has Dividend Investment Plan | No |
Socially Responsible Fund | No |
News
Headline
Wire
Time (ET)
PR Newswire
06/30 08:51