

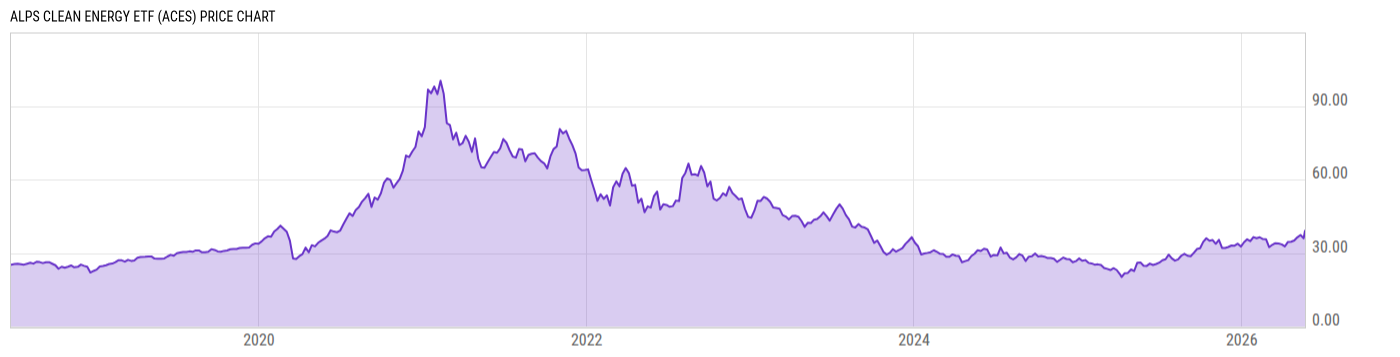
ALPS Clean Energy ETF (ACES)
36.20
-1.80
(-4.72%)
USD |
NYSEARCA |
Jun 09, 16:00
36.20
0.00 (0.00%)
After-Hours: 20:00
Price Chart
Key Stats
| Net Expense Ratio | Discount or Premium to NAV | Total Assets Under Management | 30-Day Average Daily Volume |
|---|---|---|---|
| 0.55% | -0.08% | 139.73M | 79493.50 |
| Weighted Average Dividend Yield | Turnover Ratio (Generic) | 1 Year Fund Level Flows | Max Drawdown (Since Inception) |
| 0.68% | 39.00% | -12.38M |
Basic Info
| Investment Strategy | |
| The Fund seeks investment results that correspond to the performance of the CIBC Atlas Clean Energy Index. The Index utilizes a rules-based methodology which is designed to provide exposure to a diverse set of U.S. and Canadian companies involved in the clean energy sector including renewables and clean technology. |
| General | |
| Security Type | Exchange-Traded Fund |
| Equity Style | Small Cap Core |
| Broad Asset Class | Sector Equity |
| Broad Category | Equity |
| Global Peer Group | Equity Theme - Alternative Energy |
| Peer Group | Alternative Energy Funds |
| Global Macro | Equity Theme |
| US Macro | Sector Equity Funds |
| YCharts Categorization | -- |
| YCharts Benchmark | -- |
| Prospectus Objective | Alternative Energy Funds |
| Fund Owner Firm Name | SS&C ALPS Advisors |
| Broad Asset Class Benchmark Index | |
| ^MSWNTR | 100.0% |
Performance Versus Peer Group
Annual Total Returns Versus Peers
As of June 09, 2026.
Asset Allocation
As of May 31, 2026.
| Type | % Net |
|---|---|
| Cash | 0.00% |
| Stock | 95.26% |
| Bond | 0.00% |
| Convertible | 0.00% |
| Preferred | 0.00% |
| Other | 4.74% |
Basic Info
| Investment Strategy | |
| The Fund seeks investment results that correspond to the performance of the CIBC Atlas Clean Energy Index. The Index utilizes a rules-based methodology which is designed to provide exposure to a diverse set of U.S. and Canadian companies involved in the clean energy sector including renewables and clean technology. |
| General | |
| Security Type | Exchange-Traded Fund |
| Equity Style | Small Cap Core |
| Broad Asset Class | Sector Equity |
| Broad Category | Equity |
| Global Peer Group | Equity Theme - Alternative Energy |
| Peer Group | Alternative Energy Funds |
| Global Macro | Equity Theme |
| US Macro | Sector Equity Funds |
| YCharts Categorization | -- |
| YCharts Benchmark | -- |
| Prospectus Objective | Alternative Energy Funds |
| Fund Owner Firm Name | SS&C ALPS Advisors |
| Broad Asset Class Benchmark Index | |
| ^MSWNTR | 100.0% |