

Regency Affiliates, Inc. (RAFI)
4.18
-0.02
(-0.50%)
USD |
OTCM |
May 29, 16:00
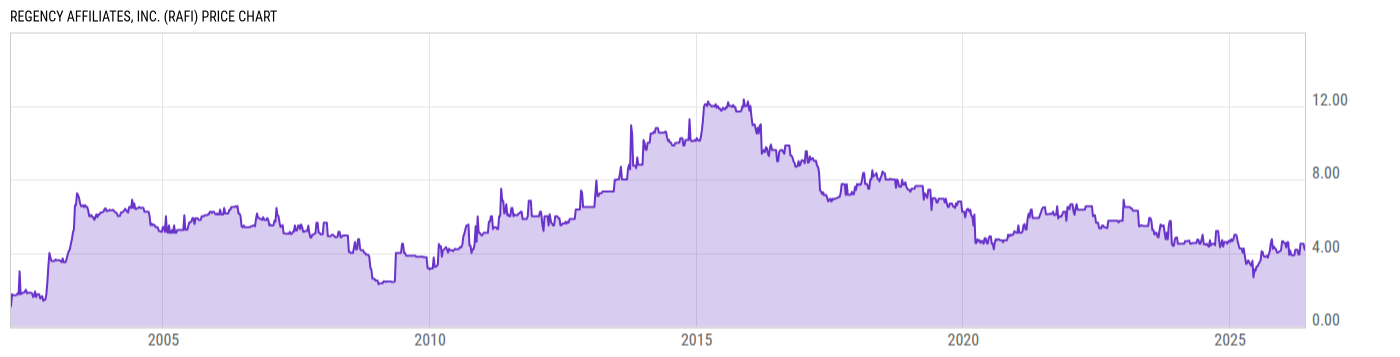
Price Chart
Key Stats
| Price and Performance | |
|---|---|
| Market Cap | 14.02M |
| 52 Week High (Daily) | |
| 52 Week Low (Daily) | |
| All-Time High (Daily) | |
| Year to Date Total Returns (Daily) | |
| 1 Month Total Returns (Daily) | |
| 1 Year Total Returns (Daily) | 26.67% |
| Valuation | |
| PE Ratio | -- |
| PE Ratio (Forward) | |
| PS Ratio | 3.588 |
| Price to Book Value | -- |
| EV to EBITDA | |
| Dividend | |
|---|---|
| Dividend | -- |
| Dividend Yield (Forward) | |
| Financials | |
| Revenue (5 Year Growth) | |
| Revenue (Quarterly YoY Growth) | |
| EPS Diluted (5 Year Growth) | |
| EPS Diluted (Quarterly YoY Growth) | |
| Debt to Equity Ratio | 0.5248 |
| Return on Equity | |
| Return on Assets | |
| Risk | |
| Beta (5Y) | |
| Max Drawdown (5Y) | 55.49% |
Profile
| Regency Affiliates, Inc. engages in investment activities. Its portfolio includes the Security West Building and Storage Depot. The company was founded on February 12, 1980 and is headquartered in New York, NY. |
| URL | http://www.regencyaffiliates.com |
| Investor Relations URL | N/A |
| HQ State/Province | New York |
| Sector | Financials |
| Industry | Financial Services |
| Next Earnings Release | N/A |
| Last Earnings Release | N/A |
| Next Ex-Dividend Date | N/A |
| Last Ex-Dividend Date | Mar. 31, 2025 |