

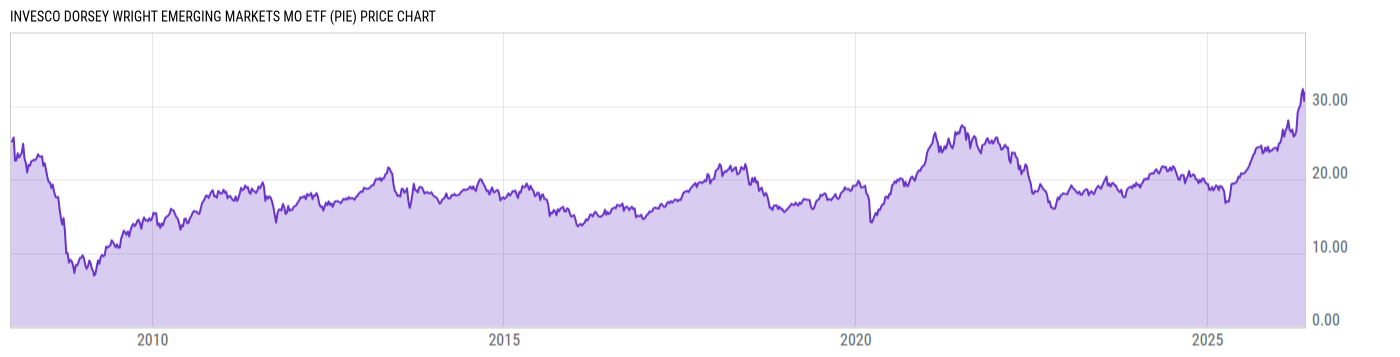
Invesco Dorsey Wright Emerging Markets Mo ETF (PIE)
31.28
+0.65
(+2.12%)
USD |
NASDAQ |
Jun 08, 16:00
31.28
0.00 (0.00%)
After-Hours: 18:11
Price Chart
Key Stats
| Net Expense Ratio | Discount or Premium to NAV | Total Assets Under Management | 30-Day Average Daily Volume |
|---|---|---|---|
| 0.90% | -1.00% | 235.14M | 66262.90 |
| Weighted Average Dividend Yield | Turnover Ratio (Generic) | 1 Year Fund Level Flows | Max Drawdown (Since Inception) |
| 2.09% | 204.0% | 74.59M |
Basic Info
| Investment Strategy | |
| The Fund seeks to track the investment results of the Dorsey Wright Emerging Markets Technical Leaders Index. The Fund invests, under normal circumstances, at least 90% of its total assets in the equity securities of large capitalization companies based in emerging market countries, comprising the Underlying Index. |
| General | |
| Security Type | Exchange-Traded Fund |
| Equity Style | Multi Cap Growth |
| Broad Asset Class | International Equity |
| Broad Category | Equity |
| Global Peer Group | Equity Emerging Markets Global |
| Peer Group | Emerging Markets Funds |
| Global Macro | Equity Emerging Markets |
| US Macro | Emerging Markets Equity Funds |
| YCharts Categorization | -- |
| YCharts Benchmark | -- |
| Prospectus Objective | Emerging Markets Funds |
| Fund Owner Firm Name | Invesco |
| Broad Asset Class Benchmark Index | |
| ^MSACXUSNTR | 100.0% |
Performance Versus Peer Group
Annual Total Returns Versus Peers
As of June 08, 2026.
Asset Allocation
As of April 30, 2026.
| Type | % Net |
|---|---|
| Cash | 0.14% |
| Stock | 99.29% |
| Bond | 0.03% |
| Convertible | 0.00% |
| Preferred | 0.54% |
| Other | 0.00% |
Basic Info
| Investment Strategy | |
| The Fund seeks to track the investment results of the Dorsey Wright Emerging Markets Technical Leaders Index. The Fund invests, under normal circumstances, at least 90% of its total assets in the equity securities of large capitalization companies based in emerging market countries, comprising the Underlying Index. |
| General | |
| Security Type | Exchange-Traded Fund |
| Equity Style | Multi Cap Growth |
| Broad Asset Class | International Equity |
| Broad Category | Equity |
| Global Peer Group | Equity Emerging Markets Global |
| Peer Group | Emerging Markets Funds |
| Global Macro | Equity Emerging Markets |
| US Macro | Emerging Markets Equity Funds |
| YCharts Categorization | -- |
| YCharts Benchmark | -- |
| Prospectus Objective | Emerging Markets Funds |
| Fund Owner Firm Name | Invesco |
| Broad Asset Class Benchmark Index | |
| ^MSACXUSNTR | 100.0% |