

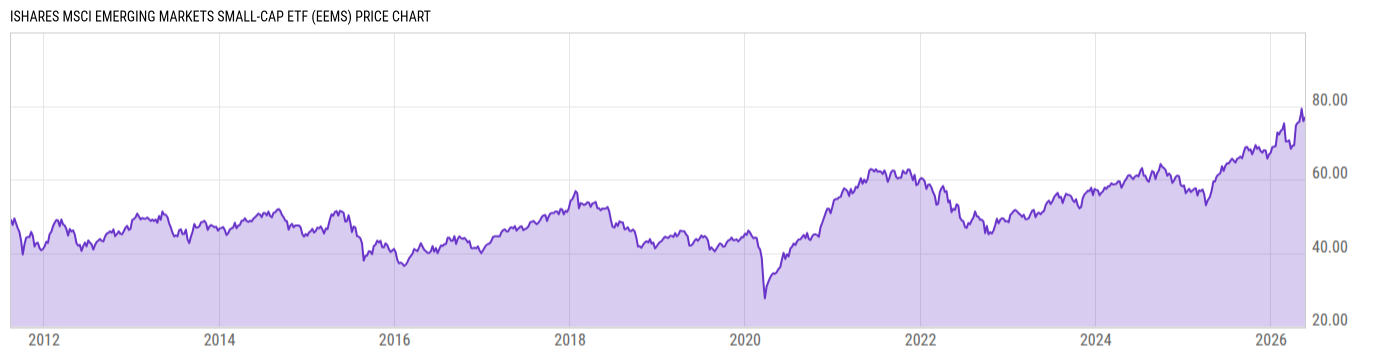
iShares MSCI Emerging Markets Small-Cap ETF (EEMS)
74.01
+0.33
(+0.45%)
USD |
NYSEARCA |
Jun 08, 16:00
74.01
0.00 (0.00%)
After-Hours: 19:07
Price Chart
Key Stats
| Net Expense Ratio | Discount or Premium to NAV | Total Assets Under Management | 30-Day Average Daily Volume |
|---|---|---|---|
| 0.72% | -2.00% | 375.90M | 83597.23 |
| Weighted Average Dividend Yield | Turnover Ratio (Generic) | 1 Year Fund Level Flows | Max Drawdown (Since Inception) |
| 2.05% | 29.00% | -75.03M |
Basic Info
| Investment Strategy | |
| The Fund seeks to track the investment results of an index composed of small-capitalization emerging market equities. The Fund generally will invest at least 90% of its assets in the component securities of the Underlying Index and in investments that have economic characteristics similar to such securities. |
| General | |
| Security Type | Exchange-Traded Fund |
| Equity Style | Mid Cap Core |
| Broad Asset Class | International Equity |
| Broad Category | Equity |
| Global Peer Group | Equity Emerging Markets Global |
| Peer Group | Emerging Markets Funds |
| Global Macro | Equity Emerging Markets |
| US Macro | Emerging Markets Equity Funds |
| YCharts Categorization | -- |
| YCharts Benchmark | -- |
| Prospectus Objective | Emerging Markets Funds |
| Fund Owner Firm Name | BlackRock |
| Broad Asset Class Benchmark Index | |
| ^MSACXUSNTR | 100.0% |
Performance Versus Peer Group
Annual Total Returns Versus Peers
As of June 08, 2026.
Asset Allocation
As of April 30, 2026.
| Type | % Net |
|---|---|
| Cash | -0.16% |
| Stock | 98.65% |
| Bond | 0.26% |
| Convertible | 0.00% |
| Preferred | 0.62% |
| Other | 0.64% |
Basic Info
| Investment Strategy | |
| The Fund seeks to track the investment results of an index composed of small-capitalization emerging market equities. The Fund generally will invest at least 90% of its assets in the component securities of the Underlying Index and in investments that have economic characteristics similar to such securities. |
| General | |
| Security Type | Exchange-Traded Fund |
| Equity Style | Mid Cap Core |
| Broad Asset Class | International Equity |
| Broad Category | Equity |
| Global Peer Group | Equity Emerging Markets Global |
| Peer Group | Emerging Markets Funds |
| Global Macro | Equity Emerging Markets |
| US Macro | Emerging Markets Equity Funds |
| YCharts Categorization | -- |
| YCharts Benchmark | -- |
| Prospectus Objective | Emerging Markets Funds |
| Fund Owner Firm Name | BlackRock |
| Broad Asset Class Benchmark Index | |
| ^MSACXUSNTR | 100.0% |