

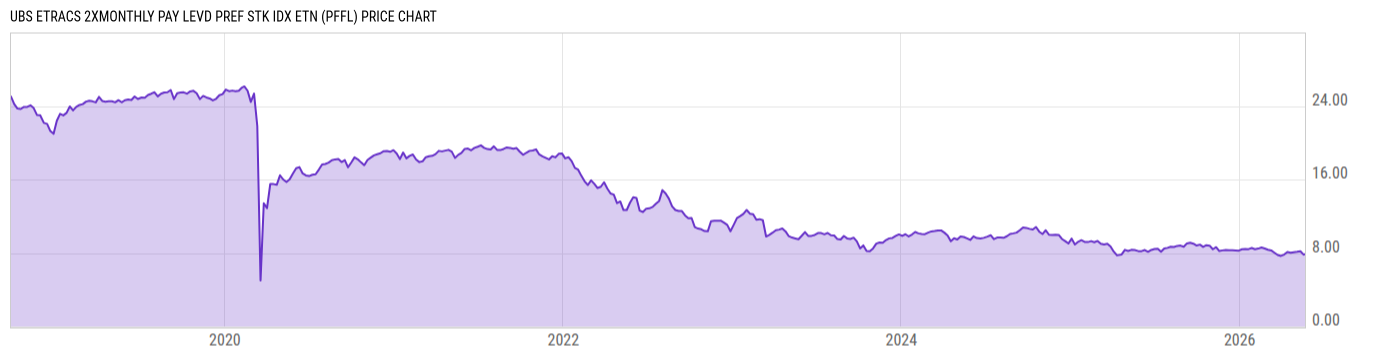
UBS ETRACS 2xMonthly Pay Levd Pref Stk Idx ETN (PFFL)
7.872
+0.01
(+0.18%)
USD |
NYSEARCA |
May 22, 16:00
7.71
-0.16
(-2.06%)
After-Hours: 20:00
Price Chart
Key Stats
| Net Expense Ratio | Discount or Premium to NAV | Total Assets Under Management | 30-Day Average Daily Volume |
|---|---|---|---|
| 0.85% | -0.51% | 4.748M | 2148.23 |
| Weighted Average Dividend Yield | Turnover Ratio (Generic) | 1 Year Fund Level Flows | Max Drawdown (Since Inception) |
| -- | -- | -4.123M |
Basic Info
| Investment Strategy | |
| The Fund seeks provide two times leveraged long exposure to the compounded monthly performance of the Solactive Preferred Stock ETF Index, reduced by the Accrued Fees. The Index is intended to track the price movements of an equally weighted portfolio containing two US preferred stock exchange traded funds. |
| General | |
| Security Type | Exchange-Traded Fund |
| Equity Style | -- |
| Broad Asset Class | Miscellaneous |
| Broad Category | Alternative Strategies |
| Global Peer Group | Alternative Equity Leveraged |
| Peer Group | Equity Leverage Funds |
| Global Macro | Alternative Equity |
| US Macro | Large-Cap Funds |
| YCharts Categorization | -- |
| YCharts Benchmark | -- |
| Prospectus Objective | Equity Leverage Funds |
| Fund Owner Firm Name | UBS Asset Management |
| Broad Asset Class Benchmark Index | |
| ^SPXTR | 100.0% |
Performance Versus Peer Group
Annual Total Returns Versus Peers
As of May 24, 2026.
Asset Allocation
| Type | % Net |
|---|
Basic Info
| Investment Strategy | |
| The Fund seeks provide two times leveraged long exposure to the compounded monthly performance of the Solactive Preferred Stock ETF Index, reduced by the Accrued Fees. The Index is intended to track the price movements of an equally weighted portfolio containing two US preferred stock exchange traded funds. |
| General | |
| Security Type | Exchange-Traded Fund |
| Equity Style | -- |
| Broad Asset Class | Miscellaneous |
| Broad Category | Alternative Strategies |
| Global Peer Group | Alternative Equity Leveraged |
| Peer Group | Equity Leverage Funds |
| Global Macro | Alternative Equity |
| US Macro | Large-Cap Funds |
| YCharts Categorization | -- |
| YCharts Benchmark | -- |
| Prospectus Objective | Equity Leverage Funds |
| Fund Owner Firm Name | UBS Asset Management |
| Broad Asset Class Benchmark Index | |
| ^SPXTR | 100.0% |