

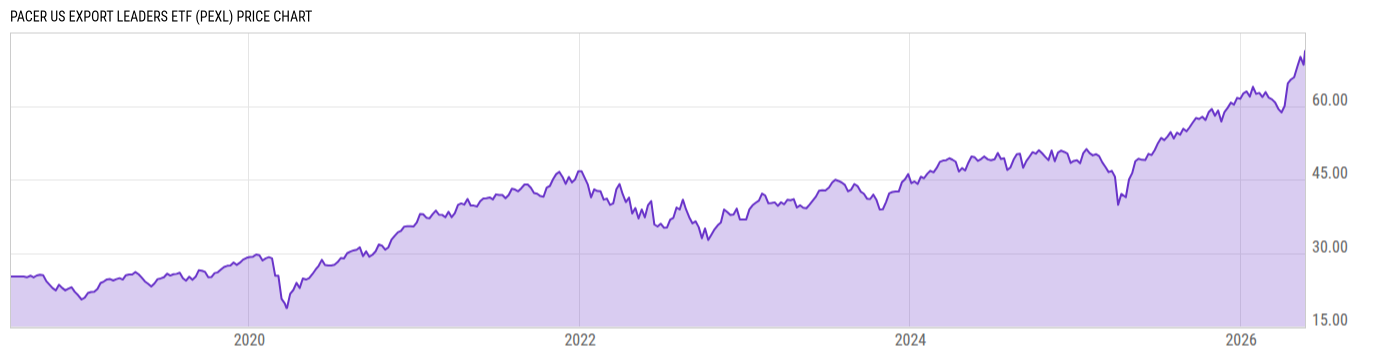
Pacer US Export Leaders ETF (PEXL)
69.72
+1.31
(+1.91%)
USD |
NYSEARCA |
May 20, 16:00
69.67
-0.05
(-0.07%)
After-Hours: 20:00
Price Chart
Key Stats
| Net Expense Ratio | Discount or Premium to NAV | Total Assets Under Management | 30-Day Average Daily Volume |
|---|---|---|---|
| 0.60% | -0.08% | 47.45M | 2031.60 |
| Weighted Average Dividend Yield | Turnover Ratio (Generic) | 1 Year Fund Level Flows | Max Drawdown (Since Inception) |
| 0.91% | 71.00% | -10.43M |
Basic Info
| Investment Strategy | |
| The Fund seeks to track the total return performance of the Pacer US Export Leaders Index. The Index is designed to measure the performance of an equal weight portfolio of approximately 100 large- and mid-capitalization US companies with a high percentage of foreign sales and high free cash flow growth. |
| General | |
| Security Type | Exchange-Traded Fund |
| Equity Style | Multi Cap Core |
| Broad Asset Class | US Equity |
| Broad Category | Equity |
| Global Peer Group | Equity US |
| Peer Group | Multi-Cap Core Funds |
| Global Macro | Equity North America |
| US Macro | Multi-Cap Funds |
| YCharts Categorization | -- |
| YCharts Benchmark | -- |
| Prospectus Objective | Growth & Income Funds |
| Fund Owner Firm Name | Pacer |
| Broad Asset Class Benchmark Index | |
| ^SPXTR | 100.0% |
Performance Versus Peer Group
Annual Total Returns Versus Peers
As of May 21, 2026.
Asset Allocation
As of April 30, 2026.
| Type | % Net |
|---|---|
| Cash | 0.05% |
| Stock | 99.95% |
| Bond | 0.00% |
| Convertible | 0.00% |
| Preferred | 0.00% |
| Other | 0.00% |
Basic Info
| Investment Strategy | |
| The Fund seeks to track the total return performance of the Pacer US Export Leaders Index. The Index is designed to measure the performance of an equal weight portfolio of approximately 100 large- and mid-capitalization US companies with a high percentage of foreign sales and high free cash flow growth. |
| General | |
| Security Type | Exchange-Traded Fund |
| Equity Style | Multi Cap Core |
| Broad Asset Class | US Equity |
| Broad Category | Equity |
| Global Peer Group | Equity US |
| Peer Group | Multi-Cap Core Funds |
| Global Macro | Equity North America |
| US Macro | Multi-Cap Funds |
| YCharts Categorization | -- |
| YCharts Benchmark | -- |
| Prospectus Objective | Growth & Income Funds |
| Fund Owner Firm Name | Pacer |
| Broad Asset Class Benchmark Index | |
| ^SPXTR | 100.0% |