

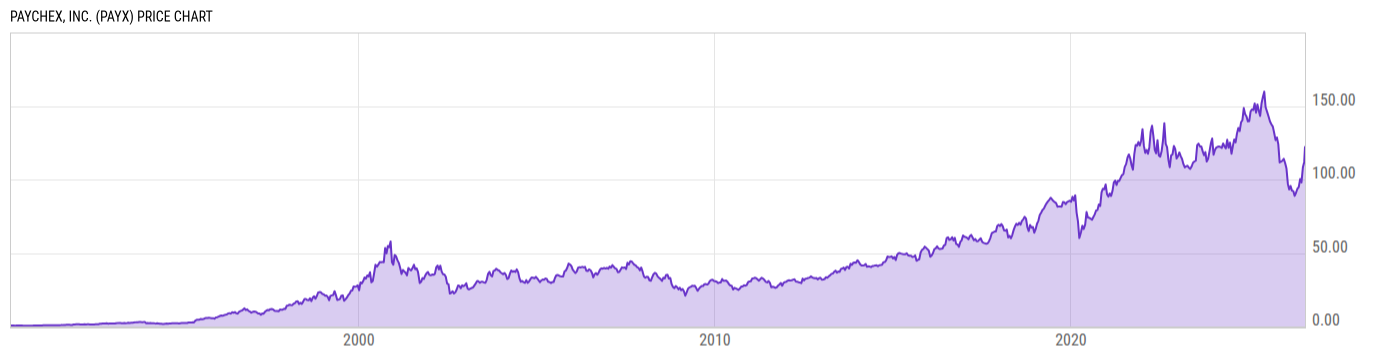
Paychex, Inc. (PAYX)
122.13
+3.26
(+2.74%)
USD |
NASDAQ |
Jul 29, 16:00
122.51
+0.38
(+0.31%)
After-Hours: 20:00
Price Chart
Key Stats
| Price and Performance | |
|---|---|
| Market Cap | 43.43B |
| 52 Week High (Daily) | |
| 52 Week Low (Daily) | |
| All-Time High (Daily) | |
| Year to Date Total Returns (Daily) | |
| 1 Month Total Returns (Daily) | |
| 1 Year Total Returns (Daily) | -13.42% |
| Valuation | |
| PE Ratio | 24.97 |
| PE Ratio (Forward) | |
| PS Ratio | 6.752 |
| Price to Book Value | 11.63 |
| EV to EBITDA | |
| Dividend | |
|---|---|
| Dividend | 1.19 |
| Dividend Yield (Forward) | |
| Financials | |
| Revenue (5 Year Growth) | |
| Revenue (Quarterly YoY Growth) | |
| EPS Diluted (5 Year Growth) | |
| EPS Diluted (Quarterly YoY Growth) | |
| Debt to Equity Ratio | 1.240 |
| Return on Equity | |
| Return on Assets | |
| Risk | |
| Beta (5Y) | |
| Max Drawdown (5Y) | 44.94% |
Profile
| Paychex, Inc. engages in the provision of human capital management solutions for payroll, human resources, insurance, and retirement for small and medium-sized businesses. Its solutions include payroll services, hiring services, business insurance, time and attendance, employee benefits, finance and payments, human resources services, and startup services. The company was founded by Blase Thomas Golisano in 1971 and is headquartered in Rochester, NY. |
| URL | http://www.paychex.com |
| Investor Relations URL | https://investor.paychex.com/ |
| HQ State/Province | New York |
| Sector | Industrials |
| Industry | Professional Services |
| Equity Style | Mid Cap Core |
| Next Earnings Release | Sep. 29, 2026 (est.) |
| Last Earnings Release | Jun. 24, 2026 |
| Next Ex-Dividend Date | N/A |
| Last Ex-Dividend Date | Jul. 28, 2026 |