

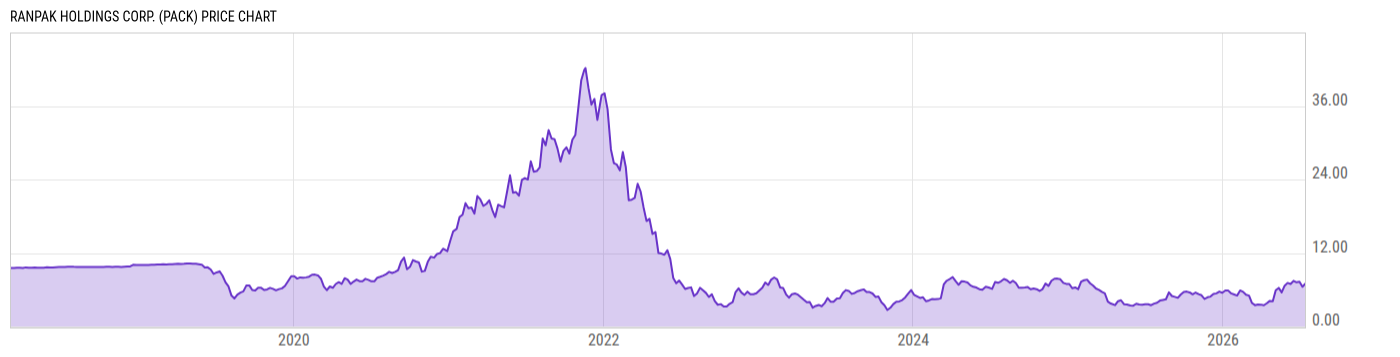
Ranpak Holdings Corp. (PACK)
6.905
-0.04
(-0.65%)
USD |
NYSE |
Jul 14, 16:00
7.05
+0.14
(+2.10%)
After-Hours: 18:42
Price Chart
Key Stats
| Price and Performance | |
|---|---|
| Market Cap | 590.58M |
| 52 Week High (Daily) | |
| 52 Week Low (Daily) | |
| All-Time High (Daily) | |
| Year to Date Total Returns (Daily) | |
| 1 Month Total Returns (Daily) | |
| 1 Year Total Returns (Daily) | 87.33% |
| Valuation | |
| PE Ratio | -- |
| PE Ratio (Forward) | |
| PS Ratio | 1.440 |
| Price to Book Value | 1.126 |
| EV to EBITDA | |
| Dividend | |
|---|---|
| Dividend | -- |
| Dividend Yield (Forward) | |
| Financials | |
| Revenue (5 Year Growth) | |
| Revenue (Quarterly YoY Growth) | |
| EPS Diluted (5 Year Growth) | |
| EPS Diluted (Quarterly YoY Growth) | |
| Debt to Equity Ratio | 0.8193 |
| Return on Equity | |
| Return on Assets | |
| Risk | |
| Beta (5Y) | |
| Max Drawdown (5Y) | 93.63% |
Profile
| Ranpak Holdings Corp. engages in the provision of product protection and end-of-line automation solutions for e-commerce and industrial supply chains. The firm's products include void fill, cushioning, wrapping, cold chain, mailers, box forming and closing, compact and book packaging, and pallet wrapping. It operates through the North America and Europe/Asia geographical segments. The North America segment sells protective packaging solutions (PPS) and automation products from Ohio, Missouri, Nevada, and Connecticut. The Europe/Asia segment refers to the sales of PPS and automation products from the Netherlands, the Czech Republic, and Malaysia. The company was founded in 1972 and is headquartered in Concord Township, OH. |
| URL | http://www.ranpak.com |
| Investor Relations URL | https://ir.ranpak.com/ |
| HQ State/Province | Ohio |
| Sector | Materials |
| Industry | Containers & Packaging |
| Equity Style | Small Cap Core |
| Next Earnings Release | Aug. 06, 2026 (est.) |
| Last Earnings Release | Apr. 30, 2026 |
| Next Ex-Dividend Date | N/A |
| Last Ex-Dividend Date | N/A |