

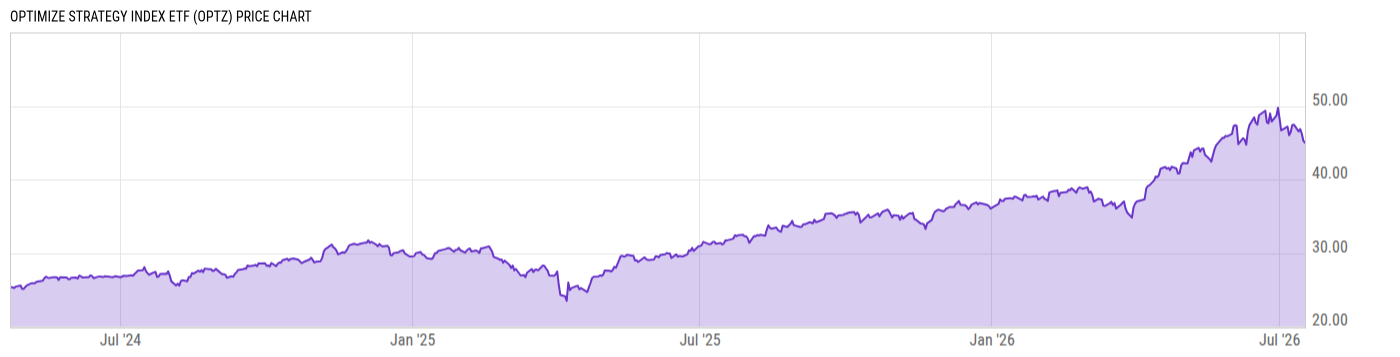
Optimize Strategy Index ETF (OPTZ)
45.00
-0.24
(-0.54%)
USD |
NASDAQ |
Jul 17, 16:00
Price Chart
Key Stats
| Net Expense Ratio | Discount or Premium to NAV | Total Assets Under Management | 30-Day Average Daily Volume |
|---|---|---|---|
| 0.30% | -0.00% | 260.12M | 5812.27 |
| Weighted Average Dividend Yield | Turnover Ratio (Generic) | 1 Year Fund Level Flows | Max Drawdown (Since Inception) |
| 0.67% | 130.0% | 4.534M |
Basic Info
| Investment Strategy | |
| The Fund seeks to track the total return performance of the Optimize Strategy Index. The Index seeks to generate returns that exceed the broader US equity market over a full economic cycle as measured by the Optimize Broad Market Index, also owned, and administered by Optimize Financial Inc., the funds sub-adviser. |
| General | |
| Security Type | Exchange-Traded Fund |
| Equity Style | Multi Cap Core |
| Broad Asset Class | US Equity |
| Broad Category | Equity |
| Global Peer Group | Equity US |
| Peer Group | Multi-Cap Core Funds |
| Global Macro | Equity North America |
| US Macro | Multi-Cap Funds |
| YCharts Categorization | -- |
| YCharts Benchmark | -- |
| Prospectus Objective | Growth & Income Funds |
| Fund Owner Firm Name | Optimize Financial |
| Broad Asset Class Benchmark Index | |
| ^SPXTR | 100.0% |
Performance Versus Peer Group
Annual Total Returns Versus Peers
As of July 20, 2026.
Asset Allocation
As of June 30, 2026.
| Type | % Net |
|---|---|
| Cash | 0.33% |
| Stock | 99.22% |
| Bond | 0.37% |
| Convertible | 0.00% |
| Preferred | 0.05% |
| Other | 0.02% |
Basic Info
| Investment Strategy | |
| The Fund seeks to track the total return performance of the Optimize Strategy Index. The Index seeks to generate returns that exceed the broader US equity market over a full economic cycle as measured by the Optimize Broad Market Index, also owned, and administered by Optimize Financial Inc., the funds sub-adviser. |
| General | |
| Security Type | Exchange-Traded Fund |
| Equity Style | Multi Cap Core |
| Broad Asset Class | US Equity |
| Broad Category | Equity |
| Global Peer Group | Equity US |
| Peer Group | Multi-Cap Core Funds |
| Global Macro | Equity North America |
| US Macro | Multi-Cap Funds |
| YCharts Categorization | -- |
| YCharts Benchmark | -- |
| Prospectus Objective | Growth & Income Funds |
| Fund Owner Firm Name | Optimize Financial |
| Broad Asset Class Benchmark Index | |
| ^SPXTR | 100.0% |