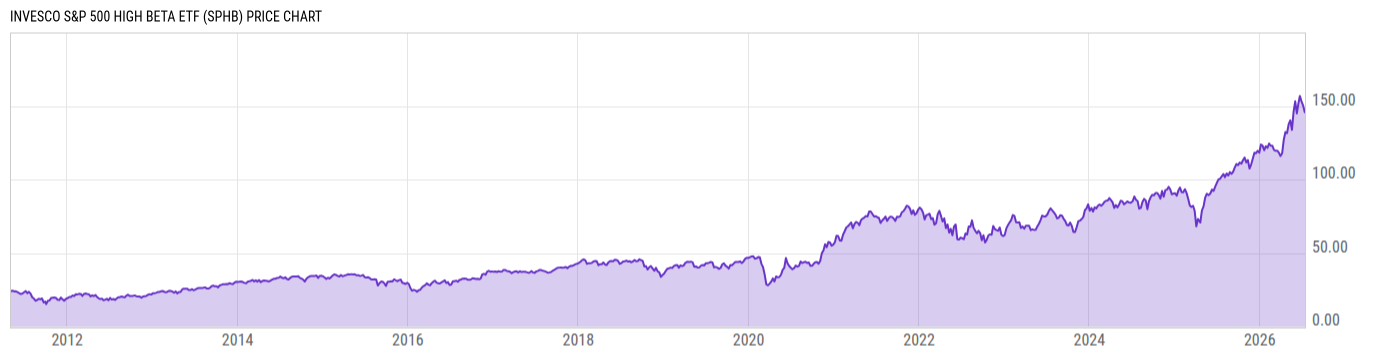
Invesco S&P 500® High Beta ETF (SPHB)
66.33
+2.67 (+4.19%)
USD |
NYSEARCA |
May 26, 16:00
66.35
+0.02 (+0.03%)
Pre-Market: 20:00
Price Chart
Key Stats
Customize
Expense Ratio | Discount or Premium to NAV | Total Assets Under Management | 30-Day Average Daily Volume |
---|---|---|---|
0.25% | -0.05% | 563.43M | 906218.1 |
Dividend Yield | Turnover Ratio | 1 Year Fund Level Flows | Max Drawdown (All) |
1.12% | 103.0% | -1.067B | Upgrade |
Basic Info
Investment Strategy | |
The investment seeks to track the investment results (before fees and expenses) of the S&P 500® High Beta Index (the "underlying index"). The fund generally will invest at least 90% of its total assets in the securities that comprise the underlying index. Strictly in accordance with its guidelines and mandated procedures, S&P Dow Jones Indices LLC compiles, maintains and calculates the index, which is designed to measure the performance of the 100 constituents of the S&P 500 ® Index that have the highest sensitivity to market returns, or “beta,” over the past 12 months as determined by the index Provider. |
General | |
Security Type | Exchange-Traded Fund |
Equity Style | Mid Cap/Growth |
Fixed Income Style | -- |
Broad Asset Class | US Equity |
Broad Category | Equity |
Category Name | Large Blend |
Category Index | Russell 1000 TR USD |
Prospectus Objective | Growth |
Fund Owner Firm Name | Invesco |
Prospectus Benchmark Index | |
S&P 500 High Beta TR USD | 100.0% |
Broad Asset Class Benchmark Index | |
^SPXTR | 100.0% |
Manager Tenure | |
Michael Jeanette | 11.00 yrs |
Peter Hubbard | 11.00 yrs |
Tony Seisser | 8.18 yrs |
Pratik Doshi | 2.36 yrs |
Net Fund Flows Versus Category
1 Month
% Rank:
--
--
Category Low
--
Category High
1 Year
% Rank:
94
-1.067B
-22.34B
Category Low
40.52B
Category High
3 Months
% Rank:
--
--
Category Low
--
Category High
3 Years
% Rank:
--
--
Category Low
--
Category High
6 Months
% Rank:
--
--
Category Low
--
Category High
5 Years
% Rank:
--
--
Category Low
--
Category High
YTD
% Rank:
--
--
Category Low
--
Category High
10 Years
% Rank:
--
--
Category Low
--
Category High
As of April 30, 2022
Performance Versus Category
As of May 26, 2022. Returns for periods of 1 year and above are annualized.
Annual Total Returns Versus Peers
As of May 26, 2022.
Asset Allocation
Top 10 Holdings
Name | % Weight | Price | % Change |
---|---|---|---|
NVIDIA Corp | 1.54% | 178.51 | 5.16% |
Enphase Energy Inc | 1.39% | 178.78 | 5.61% |
Advanced Micro Devices Inc | 1.37% | 98.75 | 6.58% |
EPAM Systems Inc | 1.34% | 322.86 | 5.69% |
Fortinet Inc | 1.34% | 294.30 | 2.43% |
KLA Corp | 1.28% | 353.28 | 4.53% |
Monolithic Power Systems Inc | 1.27% | 421.67 | 4.99% |
Albemarle Corp | 1.26% | 255.05 | 7.38% |
Applied Materials Inc | 1.25% | 115.07 | 6.03% |
Lam Research Corp | 1.24% | 509.21 | 4.44% |
News
Headline
Wire
Time (ET)
SA Breaking News
03/05 08:50
Basic Info
Investment Strategy | |
The investment seeks to track the investment results (before fees and expenses) of the S&P 500® High Beta Index (the "underlying index"). The fund generally will invest at least 90% of its total assets in the securities that comprise the underlying index. Strictly in accordance with its guidelines and mandated procedures, S&P Dow Jones Indices LLC compiles, maintains and calculates the index, which is designed to measure the performance of the 100 constituents of the S&P 500 ® Index that have the highest sensitivity to market returns, or “beta,” over the past 12 months as determined by the index Provider. |
General | |
Security Type | Exchange-Traded Fund |
Equity Style | Mid Cap/Growth |
Fixed Income Style | -- |
Broad Asset Class | US Equity |
Broad Category | Equity |
Category Name | Large Blend |
Category Index | Russell 1000 TR USD |
Prospectus Objective | Growth |
Fund Owner Firm Name | Invesco |
Prospectus Benchmark Index | |
S&P 500 High Beta TR USD | 100.0% |
Broad Asset Class Benchmark Index | |
^SPXTR | 100.0% |
Manager Tenure | |
Michael Jeanette | 11.00 yrs |
Peter Hubbard | 11.00 yrs |
Tony Seisser | 8.18 yrs |
Pratik Doshi | 2.36 yrs |
Fundamentals
General | |
Distribution Yield | Upgrade |
Dividend Yield TTM (5-26-22) | 1.12% |
30-Day SEC Yield (4-30-22) | Upgrade |
7-Day SEC Yield | -- |
Number of Holdings | Upgrade |
Stock | |
Weighted Average PE Ratio | 18.20 |
Weighted Average Price to Sales Ratio | Upgrade |
Weighted Average Price to Book Ratio | Upgrade |
Weighted Median ROE | Upgrade |
Weighted Median ROA | Upgrade |
Forecasted Dividend Yield | Upgrade |
Forecasted PE Ratio | Upgrade |
Forecasted Price to Sales Ratio | Upgrade |
Forecasted Price to Book Ratio | Upgrade |
As of May 26, 2022
Growth Estimates
Fund Details
Key Dates | |
Inception Date | 5/5/2011 |
Last Annual Report Date | 8/31/2021 |
Last Prospectus Date | 12/17/2021 |
Attributes | |
Enhanced Index Fund | No |
Index Fund |
|
Inverse Fund | No |
Leveraged Fund | No |
Fund of Funds | No |
Currency Hedged Fund | No |
Synthetic Replication Fund | No |
Has Dividend Investment Plan | No |
Socially Responsible Fund | No |
News
Headline
Wire
Time (ET)
SA Breaking News
03/05 08:50