

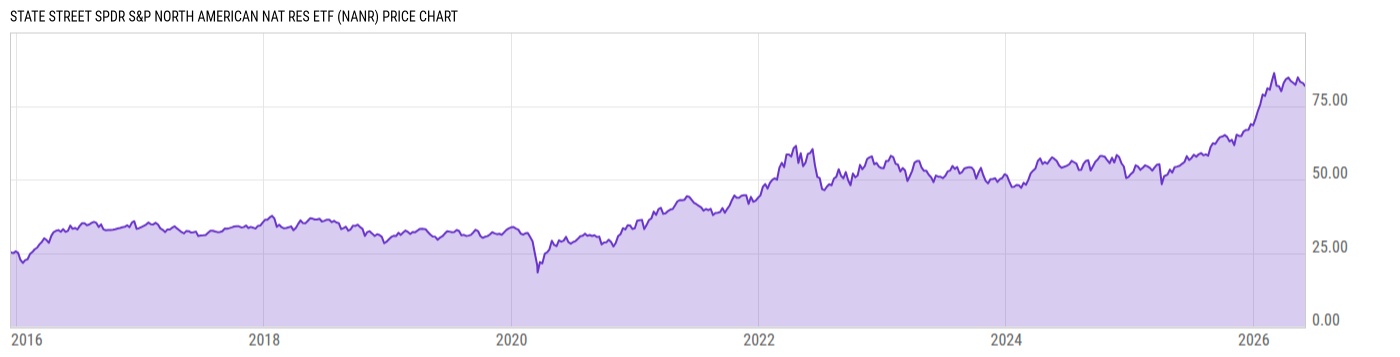
State Street SPDR S&P North American Nat Res ETF (NANR)
82.57
-0.21
(-0.25%)
USD |
NYSEARCA |
Jun 01, 16:00
82.57
0.00 (0.00%)
After-Hours: 20:00
Price Chart
Key Stats
| Net Expense Ratio | Discount or Premium to NAV | Total Assets Under Management | 30-Day Average Daily Volume |
|---|---|---|---|
| 0.35% | -0.17% | 772.92M | 31487.53 |
| Weighted Average Dividend Yield | Turnover Ratio (Generic) | 1 Year Fund Level Flows | Max Drawdown (Since Inception) |
| 1.85% | 21.00% | -154.28M |
Basic Info
| Investment Strategy | |
| The Fund seeks to provide investment results, before fees and expenses, that correspond to the total return performance of S&P BMI North American Natural Resources Index . The Index comprises publicly traded large- and mid-capitalization U.S. and Canadian companies in the natural resources and commodities businesses. |
| General | |
| Security Type | Exchange-Traded Fund |
| Equity Style | Multi Cap Value |
| Broad Asset Class | Sector Equity |
| Broad Category | Equity |
| Global Peer Group | Equity Theme - Natural Resources |
| Peer Group | Natural Resources Funds |
| Global Macro | Equity Theme |
| US Macro | Sector Equity Funds |
| YCharts Categorization | -- |
| YCharts Benchmark | -- |
| Prospectus Objective | Natural Resources Funds |
| Fund Owner Firm Name | State Street Investment Management |
| Broad Asset Class Benchmark Index | |
| ^MSWNTR | 100.0% |
Performance Versus Peer Group
Annual Total Returns Versus Peers
As of June 01, 2026.
Asset Allocation
As of April 30, 2026.
| Type | % Net |
|---|---|
| Cash | 0.06% |
| Stock | 99.93% |
| Bond | 0.01% |
| Convertible | 0.00% |
| Preferred | 0.00% |
| Other | -0.01% |
Basic Info
| Investment Strategy | |
| The Fund seeks to provide investment results, before fees and expenses, that correspond to the total return performance of S&P BMI North American Natural Resources Index . The Index comprises publicly traded large- and mid-capitalization U.S. and Canadian companies in the natural resources and commodities businesses. |
| General | |
| Security Type | Exchange-Traded Fund |
| Equity Style | Multi Cap Value |
| Broad Asset Class | Sector Equity |
| Broad Category | Equity |
| Global Peer Group | Equity Theme - Natural Resources |
| Peer Group | Natural Resources Funds |
| Global Macro | Equity Theme |
| US Macro | Sector Equity Funds |
| YCharts Categorization | -- |
| YCharts Benchmark | -- |
| Prospectus Objective | Natural Resources Funds |
| Fund Owner Firm Name | State Street Investment Management |
| Broad Asset Class Benchmark Index | |
| ^MSWNTR | 100.0% |