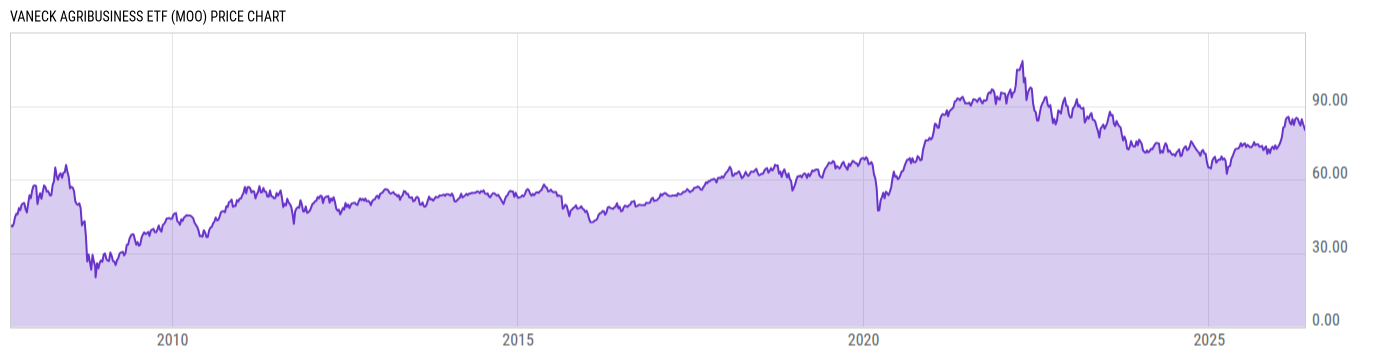
Key Stats

Expense Ratio Discount or Premium to NAV Total Assets Under Management 30-Day Average Daily Volume
0.53% -0.33% 1.253B 71535.90
Dividend Yield Turnover Ratio 1 Year Fund Level Flows Max Drawdown (All)
2.21% 24.00% 308.81M Upgrade

Basic Info

Investment Strategy
The investment seeks to replicate as closely as possible, before fees and expenses, the price and yield performance of the MVIS® Global Agribusiness Index. The fund normally invests at least 80% of its total assets in securities that comprise the fund's benchmark index. The index includes equity securities of companies that generate at least 50% of their revenues from agri-chemicals, animal health and fertilizers, seeds and traits, from farm/irrigation equipment and farm machinery, aquaculture and fishing, livestock, cultivation and plantations and trading of agricultural products. It is non-diversified.
General
Security Type Exchange-Traded Fund
Equity Style Large Cap/Value
Fixed Income Style --
Broad Asset Class Sector Equity
Broad Category Equity
Category Name Natural Resources
Category Index S&P North American Natural Resources TR
Global Category Name Natural Resources Sector Equity
YCharts Categorization Natural Resources Equity
YCharts Benchmark S&P BMI North American Natural Resources Index Net Total Return (^SPBMNANRN)
Prospectus Objective Specialty - Unaligned
Fund Owner Firm Name VanEck
Prospectus Benchmark Index
MVIS Global Agribusiness NR USD 100.0%
Broad Asset Class Benchmark Index
^MSWNTR 100.0%
Manager Tenure
Peter Liao 15.51 yrs

Net Fund Flows Versus Category

View Net Fund Flows. Upgrade now.
1M
3M
6M
YTD
1Y
3Y
5Y
10Y
 
80.00B
60.00B
40.00B
20.00B
0
-20.00B
1 Month
% Rank: --
-- Category Low
-- Category High
1 Year
% Rank: 15
308.81M
-996.86M Category Low
1.257B Category High
3 Months
% Rank: --
-- Category Low
-- Category High
3 Years
% Rank: --
-- Category Low
-- Category High
6 Months
% Rank: --
-- Category Low
-- Category High
5 Years
% Rank: --
-- Category Low
-- Category High
YTD
% Rank: --
-- Category Low
-- Category High
10 Years
% Rank: --
-- Category Low
-- Category High
As of February 28, 2023

Performance Versus Category

 
20%
15%
10%
5%
0
View Category Returns. Upgrade now.
Name
1M
3M
YTD
1Y
3Y
5Y
10Y
15Y
Total Return (Price)
--
--
--
--
--
--
--
--
Total Return (NAV)
--
--
--
--
--
--
--
--
Category Rtn. (NAV)
--
--
--
--
--
--
--
--
% Rank in Cat (NAV)
--
--
--
--
--
--
--
--
As of March 23, 2023. Returns for periods of 1 year and above are annualized.

Annual Total Returns Versus Peers

Loading chart...
Name
2016
2017
2018
2019
2020
2021
2022
YTD
12.81%
21.72%
-6.01%
22.35%
14.59%
24.01%
-8.09%
-2.47%
7.51%
22.40%
-8.71%
27.67%
15.90%
21.82%
-18.14%
3.98%
10.01%
24.91%
-19.46%
9.07%
13.88%
17.28%
-4.54%
-1.97%
70.35%
38.89%
-31.31%
12.48%
51.62%
23.39%
-0.71%
3.30%
30.84%
22.63%
-13.18%
16.45%
-0.05%
24.74%
10.23%
-4.45%
31.27%
18.73%
-9.40%
18.40%
0.51%
26.12%
14.91%
-6.56%
As of March 23, 2023.

Fundamentals

General
Distribution Yield Upgrade
Dividend Yield TTM (3-24-23) 2.21%
30-Day SEC Yield (2-28-23) Upgrade
7-Day SEC Yield --
Number of Holdings Upgrade
Stock
Weighted Average PE Ratio 10.84
Weighted Average Price to Sales Ratio Upgrade
Weighted Average Price to Book Ratio Upgrade
Weighted Median ROE Upgrade
Weighted Median ROA Upgrade
Forecasted Dividend Yield Upgrade
Forecasted PE Ratio Upgrade
Forecasted Price to Sales Ratio Upgrade
Forecasted Price to Book Ratio Upgrade
As of March 22, 2023

Growth Estimates

Forecasted 5 Yr Earnings Growth Upgrade
Forecasted Book Value Growth Upgrade
Forecasted Cash Flow Growth Upgrade
Forecasted Earnings Growth Upgrade
Forecasted Revenue Growth Upgrade
As of March 22, 2023

Asset Allocation

As of March 22, 2023.
Type % Net % Long % Short
Cash -0.00% Upgrade Upgrade
Stock 100.0% Upgrade Upgrade
Bond 0.00% Upgrade Upgrade
Convertible 0.00% Upgrade Upgrade
Preferred 0.00% Upgrade Upgrade
Other 0.00% Upgrade Upgrade

Top 10 Holdings

Name % Weight Price % Change
Zoetis Inc Class A 8.10% 164.16 1.81%
Deere & Co 7.88% 386.51 -1.36%
Bayer AG 7.28% 59.36 -2.92%
Nutrien Ltd 6.29% 98.56 -1.89%
Corteva Inc 5.87% 56.86 0.10%
Archer-Daniels Midland Co 5.61% 76.62 1.98%
CNH Industrial NV 3.81% 14.57 0.00%
Tyson Foods Inc Class A 3.57% 57.06 1.76%
Sociedad Quimica Y Minera De Chile SA ADR 3.15% 80.94 -0.15%
FMC Corp 3.14% 117.62 0.56%

Basic Info

Investment Strategy
The investment seeks to replicate as closely as possible, before fees and expenses, the price and yield performance of the MVIS® Global Agribusiness Index. The fund normally invests at least 80% of its total assets in securities that comprise the fund's benchmark index. The index includes equity securities of companies that generate at least 50% of their revenues from agri-chemicals, animal health and fertilizers, seeds and traits, from farm/irrigation equipment and farm machinery, aquaculture and fishing, livestock, cultivation and plantations and trading of agricultural products. It is non-diversified.
General
Security Type Exchange-Traded Fund
Equity Style Large Cap/Value
Fixed Income Style --
Broad Asset Class Sector Equity
Broad Category Equity
Category Name Natural Resources
Category Index S&P North American Natural Resources TR
Global Category Name Natural Resources Sector Equity
YCharts Categorization Natural Resources Equity
YCharts Benchmark S&P BMI North American Natural Resources Index Net Total Return (^SPBMNANRN)
Prospectus Objective Specialty - Unaligned
Fund Owner Firm Name VanEck
Prospectus Benchmark Index
MVIS Global Agribusiness NR USD 100.0%
Broad Asset Class Benchmark Index
^MSWNTR 100.0%
Manager Tenure
Peter Liao 15.51 yrs

Fundamentals

General
Distribution Yield Upgrade
Dividend Yield TTM (3-24-23) 2.21%
30-Day SEC Yield (2-28-23) Upgrade
7-Day SEC Yield --
Number of Holdings Upgrade
Stock
Weighted Average PE Ratio 10.84
Weighted Average Price to Sales Ratio Upgrade
Weighted Average Price to Book Ratio Upgrade
Weighted Median ROE Upgrade
Weighted Median ROA Upgrade
Forecasted Dividend Yield Upgrade
Forecasted PE Ratio Upgrade
Forecasted Price to Sales Ratio Upgrade
Forecasted Price to Book Ratio Upgrade
As of March 22, 2023

Growth Estimates

Forecasted 5 Yr Earnings Growth Upgrade
Forecasted Book Value Growth Upgrade
Forecasted Cash Flow Growth Upgrade
Forecasted Earnings Growth Upgrade
Forecasted Revenue Growth Upgrade
As of March 22, 2023

Fund Details

Key Dates
Inception Date 8/31/2007
Last Annual Report Date 12/31/2022
Last Prospectus Date 5/1/2022
Attributes
Index Fund Yes
Inverse Fund No
Leveraged Fund No
Fund of Funds No
Currency Hedged Fund No
Synthetic Replication Fund No
Has Dividend Investment Plan No
Socially Responsible Fund No

Top Portfolio Holders

0 of 0