

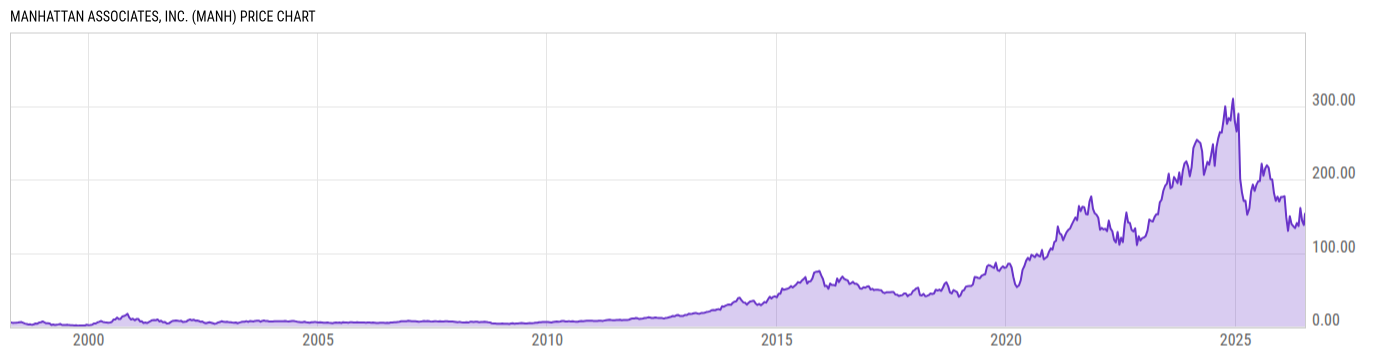
Manhattan Associates, Inc. (MANH)
204.02
+35.85
(+21.32%)
USD |
NASDAQ |
Jul 29, 16:00
205.00
+0.98
(+0.48%)
After-Hours: 20:00
Price Chart
Key Stats
| Price and Performance | |
|---|---|
| Market Cap | 12.07B |
| 52 Week High (Daily) | |
| 52 Week Low (Daily) | |
| All-Time High (Daily) | |
| Year to Date Total Returns (Daily) | |
| 1 Month Total Returns (Daily) | |
| 1 Year Total Returns (Daily) | -9.49% |
| Valuation | |
| PE Ratio | 57.16 |
| PE Ratio (Forward) | |
| PS Ratio | 11.25 |
| Price to Book Value | 58.83 |
| EV to EBITDA | |
| Dividend | |
|---|---|
| Dividend | -- |
| Dividend Yield (Forward) | |
| Financials | |
| Revenue (5 Year Growth) | |
| Revenue (Quarterly YoY Growth) | |
| EPS Diluted (5 Year Growth) | |
| EPS Diluted (Quarterly YoY Growth) | |
| Debt to Equity Ratio | 0.2714 |
| Return on Equity | |
| Return on Assets | |
| Risk | |
| Beta (5Y) | |
| Max Drawdown (5Y) | 60.98% |
Profile
| Manhattan Associates, Inc. engages in the business of developing, selling, deploying, servicing, and maintaining software solutions designed to manage supply chains, inventory, and omnichannel operations for retailers, wholesalers, manufacturers, logistics providers, and other organizations. It operates through the following geographical segments: North and Latin America, Europe, Middle East, and Africa, and Asia Pacific. The company was founded by Deepak Raghavan in October 1990 and is headquartered in Atlanta, GA. |
| URL | http://www.manh.com |
| Investor Relations URL | https://ir.manh.com |
| HQ State/Province | Georgia |
| Sector | Information Technology |
| Industry | Software |
| Equity Style | Small Cap Growth |
| Next Earnings Release | Oct. 27, 2026 (est.) |
| Last Earnings Release | Jul. 28, 2026 |
| Next Ex-Dividend Date | N/A |
| Last Ex-Dividend Date | N/A |