

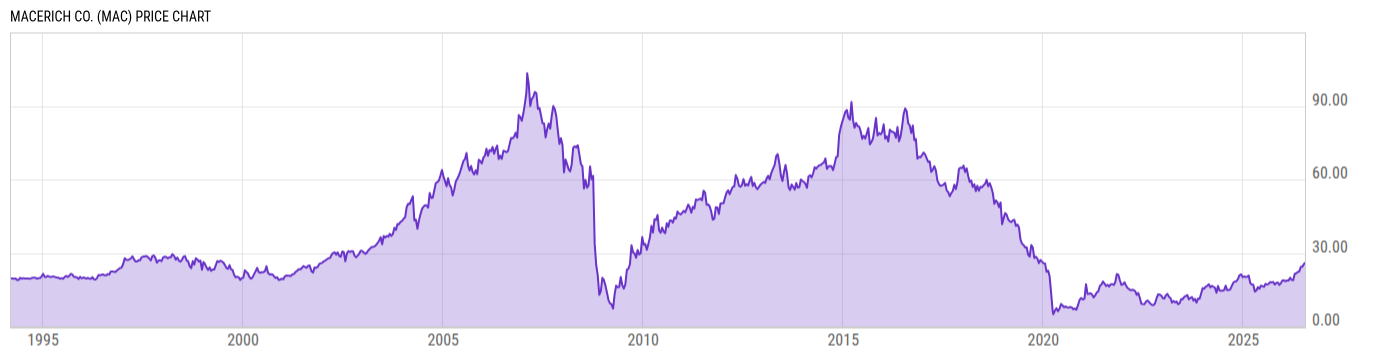
Macerich Co. (MAC)
25.92
+0.09
(+0.35%)
USD |
NYSE |
Jul 17, 16:00
25.91
-0.01
(-0.04%)
Pre-Market: 20:00
Price Chart
Key Stats
| Price and Performance | |
|---|---|
| Market Cap | 6.756B |
| 52 Week High (Daily) | |
| 52 Week Low (Daily) | |
| All-Time High (Daily) | |
| Year to Date Total Returns (Daily) | |
| 1 Month Total Returns (Daily) | |
| 1 Year Total Returns (Daily) | 61.28% |
| Valuation | |
| PE Ratio | -- |
| PE Ratio (Forward) | |
| PS Ratio | 7.054 |
| Price to Book Value | 2.771 |
| EV to EBITDA | |
| Dividend | |
|---|---|
| Dividend | 0.17 |
| Dividend Yield (Forward) | |
| Financials | |
| Revenue (5 Year Growth) | |
| Revenue (Quarterly YoY Growth) | |
| EPS Diluted (5 Year Growth) | |
| EPS Diluted (Quarterly YoY Growth) | |
| Debt to Equity Ratio | 2.074 |
| Return on Equity | |
| Return on Assets | |
| Risk | |
| Beta (5Y) | |
| Max Drawdown (5Y) | 84.81% |
Profile
| Macerich Co. operates as a real estate investment trust, which engages in the acquisition, ownership, development, redevelopment, management, and leasing of regional and community shopping centers located throughout the United States. The company was founded by Mace Siegel, Dana K. Anderson, Arthur M. Coppola and Edward C. Coppola in 1964 and is headquartered in Santa Monica, CA. |
| URL | http://www.macerich.com |
| Investor Relations URL | https://investing.macerich.com |
| HQ State/Province | California |
| Sector | Real Estate |
| Industry | Retail REITs |
| Equity Style | Small Cap Value |
| Next Earnings Release | Aug. 04, 2026 |
| Last Earnings Release | May. 06, 2026 |
| Next Ex-Dividend Date | N/A |
| Last Ex-Dividend Date | Jun. 15, 2026 |