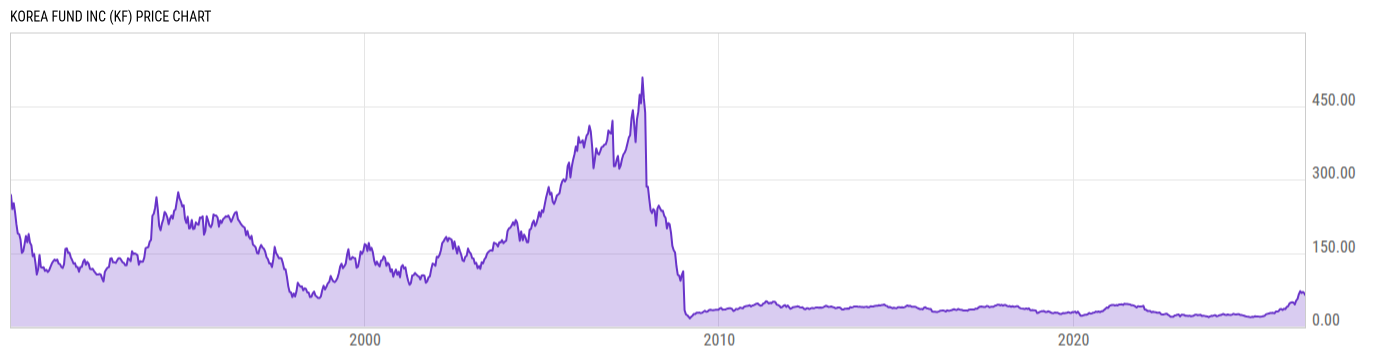
Key Stats

Expense Ratio Discount or Premium to NAV Total Assets Under Management 30-Day Average Daily Volume
1.21% -15.86% 126.94M 9426.97
Dividend Yield Turnover Ratio 1 Year Fund Level Flows Max Drawdown (All)
0.24% 35.00% -- Upgrade

Basic Info

Investment Strategy
The investment objective of the Fund is to seek long-term capital appreciation through investment in securities, primarily equity securities, of Korean companies. This objective is a fundamental policy and may not be changed without the approval of a majority of the Fund’s outstanding voting securities. As used in this report, a “majority of the Fund’s outstanding voting securities” means the lesser of (i) 67% of the shares represented at a meeting at which more than 50% of the outstanding shares are represented or (ii) more than 50% of the outstanding shares.
General
Security Type Closed-End Fund
Equity Style Large Cap/Value
Fixed Income Style --
Broad Asset Class International Equity
Broad Category Equity
Category Name Miscellaneous Region
Category Index MSCI ACWI Ex USA NR USD
Global Category Name Equity Miscellaneous
YCharts Categorization Other
YCharts Benchmark S&P 500 Total Return (^SPXTR)
Prospectus Objective Pacific Stock
Fund Owner Firm Name JPMorgan Asset Management (Asia Pacific) Limited
Prospectus Benchmark Index
MSCI Korea 25/50 Net Total Return NR 100.0%
Broad Asset Class Benchmark Index
^MSACXUSNTR 100.0%
Manager Tenure
John Cho 9.03 yrs
Ayaz Ebrahim 3.00 yrs

Net Fund Flows Versus Category

1M
3M
6M
YTD
1Y
3Y
5Y
10Y
 
80.00B
60.00B
40.00B
20.00B
0
-20.00B
No Data Available
1 Month
% Rank: --
-- Category Low
-- Category High
1 Year
% Rank: --
-764.72M Category Low
936.78M Category High
3 Months
% Rank: --
-- Category Low
-- Category High
3 Years
% Rank: --
-- Category Low
-- Category High
6 Months
% Rank: --
-- Category Low
-- Category High
5 Years
% Rank: --
-- Category Low
-- Category High
YTD
% Rank: --
-- Category Low
-- Category High
10 Years
% Rank: --
-- Category Low
-- Category High
Date Unavailable

Performance Versus Category

 
20%
15%
10%
5%
0
View Category Returns. Upgrade now.
Name
1M
3M
YTD
1Y
3Y
5Y
10Y
15Y
Total Return (Price)
--
--
--
--
--
--
--
--
Total Return (NAV)
--
--
--
--
--
--
--
--
Category Rtn. (NAV)
--
--
--
--
--
--
--
--
% Rank in Cat (NAV)
--
--
--
--
--
--
--
--
As of March 29, 2023. Returns for periods of 1 year and above are annualized.

Annual Total Returns Versus Peers

Loading chart...
Name
2016
2017
2018
2019
2020
2021
2022
YTD
1.13%
42.53%
-19.29%
6.83%
37.14%
8.31%
-30.08%
3.45%
4.50%
27.19%
-14.20%
21.51%
10.65%
7.82%
-16.00%
5.23%
8.44%
45.00%
-20.38%
7.95%
39.44%
-7.56%
-26.60%
6.23%
--
--
-21.31%
8.85%
42.65%
-7.53%
-27.52%
6.02%
-4.04%
24.32%
-6.27%
-1.42%
3.17%
-7.41%
-5.98%
-3.28%
-8.55%
28.73%
-17.19%
26.97%
1.67%
14.41%
-14.10%
11.69%
As of March 29, 2023.

Fundamentals

General
Distribution Yield Upgrade
Dividend Yield TTM (3-29-23) 0.24%
30-Day SEC Yield --
7-Day SEC Yield --
Number of Holdings Upgrade
Stock
Weighted Average PE Ratio 7.777
Weighted Average Price to Sales Ratio Upgrade
Weighted Average Price to Book Ratio Upgrade
Weighted Median ROE Upgrade
Weighted Median ROA Upgrade
Forecasted Dividend Yield Upgrade
Forecasted PE Ratio Upgrade
Forecasted Price to Sales Ratio Upgrade
Forecasted Price to Book Ratio Upgrade
As of December 31, 2022

Growth Estimates

Forecasted 5 Yr Earnings Growth Upgrade
Forecasted Book Value Growth Upgrade
Forecasted Cash Flow Growth Upgrade
Forecasted Earnings Growth Upgrade
Forecasted Revenue Growth Upgrade
As of December 31, 2022

Asset Allocation

As of December 31, 2022.
Type % Net % Long % Short
Cash 1.33% Upgrade Upgrade
Stock 109.5% Upgrade Upgrade
Bond 0.00% Upgrade Upgrade
Convertible 0.00% Upgrade Upgrade
Preferred 0.00% Upgrade Upgrade
Other -10.82% Upgrade Upgrade

Top 10 Holdings

Name % Weight Price % Change
Samsung Electronics Co Ltd 24.66% 40.60 0.00%
SK Hynix Inc
7.01% -- --
LG Chem Ltd
6.65% -- --
NAVER Corp 4.05% 115.00 0.00%
Hyundai Mobis Co Ltd
3.92% -- --
KB Financial Group Inc
3.80% -- --
POSCO Holdings Inc 3.49% -- --
Hana Financial Group Inc
3.39% -- --
Samsung BioLogics Co Ltd
3.15% -- --
NCsoft Corp
2.83% -- --

Basic Info

Investment Strategy
The investment objective of the Fund is to seek long-term capital appreciation through investment in securities, primarily equity securities, of Korean companies. This objective is a fundamental policy and may not be changed without the approval of a majority of the Fund’s outstanding voting securities. As used in this report, a “majority of the Fund’s outstanding voting securities” means the lesser of (i) 67% of the shares represented at a meeting at which more than 50% of the outstanding shares are represented or (ii) more than 50% of the outstanding shares.
General
Security Type Closed-End Fund
Equity Style Large Cap/Value
Fixed Income Style --
Broad Asset Class International Equity
Broad Category Equity
Category Name Miscellaneous Region
Category Index MSCI ACWI Ex USA NR USD
Global Category Name Equity Miscellaneous
YCharts Categorization Other
YCharts Benchmark S&P 500 Total Return (^SPXTR)
Prospectus Objective Pacific Stock
Fund Owner Firm Name JPMorgan Asset Management (Asia Pacific) Limited
Prospectus Benchmark Index
MSCI Korea 25/50 Net Total Return NR 100.0%
Broad Asset Class Benchmark Index
^MSACXUSNTR 100.0%
Manager Tenure
John Cho 9.03 yrs
Ayaz Ebrahim 3.00 yrs

Fundamentals

General
Distribution Yield Upgrade
Dividend Yield TTM (3-29-23) 0.24%
30-Day SEC Yield --
7-Day SEC Yield --
Number of Holdings Upgrade
Stock
Weighted Average PE Ratio 7.777
Weighted Average Price to Sales Ratio Upgrade
Weighted Average Price to Book Ratio Upgrade
Weighted Median ROE Upgrade
Weighted Median ROA Upgrade
Forecasted Dividend Yield Upgrade
Forecasted PE Ratio Upgrade
Forecasted Price to Sales Ratio Upgrade
Forecasted Price to Book Ratio Upgrade
As of December 31, 2022

Growth Estimates

Forecasted 5 Yr Earnings Growth Upgrade
Forecasted Book Value Growth Upgrade
Forecasted Cash Flow Growth Upgrade
Forecasted Earnings Growth Upgrade
Forecasted Revenue Growth Upgrade
As of December 31, 2022

Fund Details

Key Dates
Inception Date 8/29/1984
Last Annual Report Date 6/30/2022
Last Prospectus Date 3/31/1997
Attributes
Index Fund No
Inverse Fund No
Leveraged Fund Yes
Fund of Funds No
Currency Hedged Fund No
Synthetic Replication Fund No
Has Dividend Investment Plan Yes
Socially Responsible Fund No

Top Portfolio Holders

0 of 0