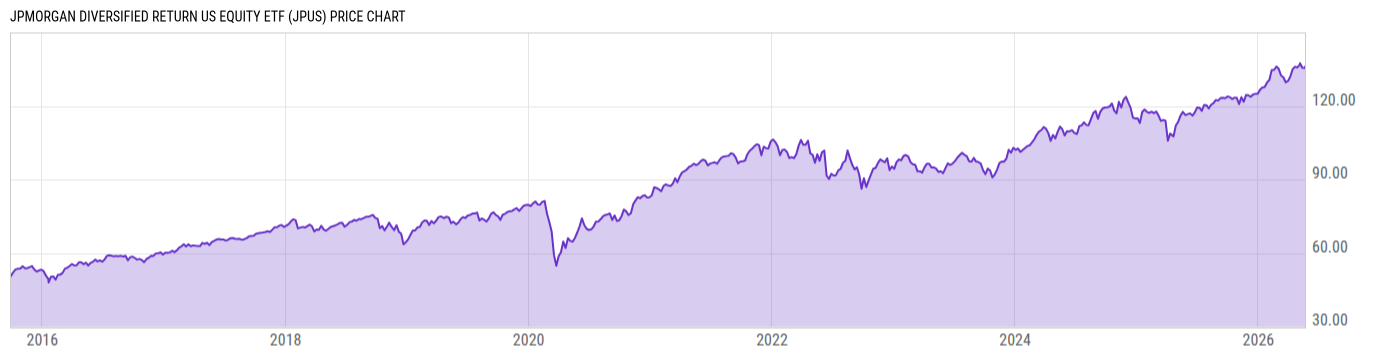
JPMorgan Diversified Return US Eq ETF (JPUS)
86.11
-0.44 (-0.51%)
USD |
Jan 15, 20:00
Price Chart
Key Stats
Customize
Expense Ratio | Discount or Premium to NAV | Total Assets Under Management | 30-Day Average Daily Volume |
---|---|---|---|
0.18% | -0.03% | 628.82M | 15916.97 |
Dividend Yield | Turnover Ratio | 1 Year Fund Level Flows | Max Drawdown (All) |
1.89% | 21.00% | -208.71M | Upgrade |
Basic Info
Investment Strategy | |
The investment seeks investment results that closely correspond, before fees and expenses, to the performance of the JP Morgan Diversified Factor US Equity Index. The fund will invest at least 80% of its net assets in securities included in the underlying index. The underlying index is comprised of U.S. equity securities selected to represent a diversified set of factor characteristics: value, momentum, and quality. The fund's securities are large- and mid-cap equity securities of U.S. companies, including common stock, preferred stock and real estate investment trusts. |
General | |
Security Type | Exchange-Traded Fund |
Equity Style | Mid Cap/Value |
Fixed Income Style | -- |
Broad Asset Class | US Equity |
Broad Category | Equity |
Category Name | Large Blend |
Category Index | Russell 1000 TR USD |
Prospectus Objective | Growth and Income |
Fund Owner Firm Name | JPMorgan |
Prospectus Benchmark Index | |
JPM Diversified Factor US Equity TR USD | 100.0% |
Broad Asset Class Benchmark Index | |
^SPXTR | 100.0% |
Manager Tenure | |
Joe Staines | 4.13 yrs |
Yazann Romahi | 4.13 yrs |
Yegang(Steven) Wu | 4.13 yrs |
Alistair Lowe | 0.00 yrs |
Net Fund Flows Versus Category
1 Month
% Rank:
--
--
Category Low
--
Category High
1 Year
% Rank:
70
-208.71M
-25.66B
Category Low
10.63B
Category High
3 Months
% Rank:
--
--
Category Low
--
Category High
3 Years
% Rank:
--
--
Category Low
--
Category High
6 Months
% Rank:
--
--
Category Low
--
Category High
5 Years
% Rank:
--
--
Category Low
--
Category High
YTD
% Rank:
--
--
Category Low
--
Category High
10 Years
% Rank:
--
--
Category Low
--
Category High
As of December 31, 2020
Performance Versus Category
As of January 15, 2021. Returns for periods of 1 year and above are annualized.
Annual Total Returns Versus Peers
Edit comparables
As of January 15, 2021.
Asset Allocation
Top 10 Holdings
Name | % Weight | Price | % Change |
---|---|---|---|
Enphase Energy Inc | 0.58% | 190.59 | -8.73% |
The AES Corp | 0.51% | 27.60 | 0.55% |
Albemarle Corp | 0.50% | 180.14 | -1.22% |
The Scotts Miracle Gro Co A | 0.48% | 220.89 | -1.37% |
Halliburton Co | 0.47% | 20.74 | -4.69% |
Teradyne Inc | 0.47% | 137.30 | -0.79% |
Morgan Stanley | 0.47% | 75.24 | -1.61% |
Lam Research Corp | 0.46% | 547.53 | -1.84% |
CF Industries Holdings Inc | 0.46% | 45.56 | 0.57% |
SolarEdge Technologies Inc | 0.45% | 282.26 | -15.84% |
News
Headline
Wire
Time (ET)
PR Newswire
12/21 10:26
Basic Info
Investment Strategy | |
The investment seeks investment results that closely correspond, before fees and expenses, to the performance of the JP Morgan Diversified Factor US Equity Index. The fund will invest at least 80% of its net assets in securities included in the underlying index. The underlying index is comprised of U.S. equity securities selected to represent a diversified set of factor characteristics: value, momentum, and quality. The fund's securities are large- and mid-cap equity securities of U.S. companies, including common stock, preferred stock and real estate investment trusts. |
General | |
Security Type | Exchange-Traded Fund |
Equity Style | Mid Cap/Value |
Fixed Income Style | -- |
Broad Asset Class | US Equity |
Broad Category | Equity |
Category Name | Large Blend |
Category Index | Russell 1000 TR USD |
Prospectus Objective | Growth and Income |
Fund Owner Firm Name | JPMorgan |
Prospectus Benchmark Index | |
JPM Diversified Factor US Equity TR USD | 100.0% |
Broad Asset Class Benchmark Index | |
^SPXTR | 100.0% |
Manager Tenure | |
Joe Staines | 4.13 yrs |
Yazann Romahi | 4.13 yrs |
Yegang(Steven) Wu | 4.13 yrs |
Alistair Lowe | 0.00 yrs |
Fundamentals
General | |
Distribution Yield | Upgrade |
Dividend Yield TTM (1-15-21) | 1.89% |
30-Day SEC Yield (12-31-20) | Upgrade |
7-Day SEC Yield | -- |
Number of Holdings | Upgrade |
Stock | |
Weighted Average PE Ratio | 21.89 |
Weighted Average Price to Sales Ratio | Upgrade |
Weighted Average Price to Book Ratio | Upgrade |
Weighted Median ROE | Upgrade |
Weighted Median ROA | Upgrade |
Forecasted Dividend Yield | Upgrade |
Forecasted PE Ratio | Upgrade |
Forecasted Price to Sales Ratio | Upgrade |
Forecasted Price to Book Ratio | Upgrade |
As of January 14, 2021
Growth Estimates
Fund Details
Key Dates | |
Inception Date | 9/29/2015 |
Last Annual Report Date | 10/31/2020 |
Last Prospectus Date | 3/1/2020 |
Attributes | |
Enhanced Index Fund | No |
Index Fund |
|
Inverse Fund | No |
Leveraged Fund | No |
Fund of Funds | No |
Currency Hedged Fund | No |
Synthetic Replication Fund | No |
Has Dividend Investment Plan | No |
Socially Responsible Fund | No |
News
Headline
Wire
Time (ET)
PR Newswire
12/21 10:26