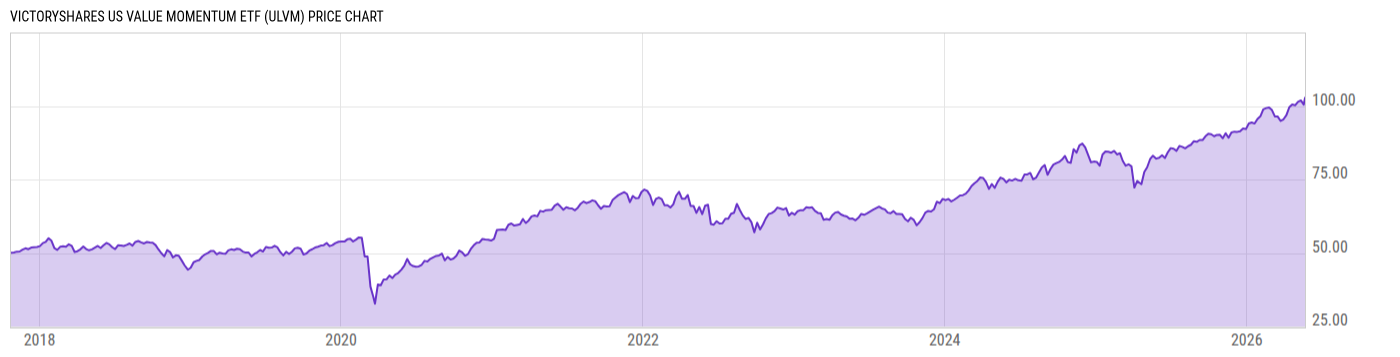
VictoryShares US Value Momentum ETF (ULVM)
62.95
+0.67
(+1.08%)
USD |
NYSEARCA |
Mar 31, 16:00
Key Stats
Expense Ratio | Discount or Premium to NAV | Total Assets Under Management | 30-Day Average Daily Volume |
---|---|---|---|
0.20% | -0.16% | 227.56M | 1384.33 |
Dividend Yield | Turnover Ratio | 1 Year Fund Level Flows | Max Drawdown (All) |
1.73% | 73.00% | -68.40M | Upgrade |
Basic Info
Investment Strategy | |
The investment seeks to provide investment results that closely correspond, before fees and expenses, to the performance of the Nasdaq Victory US Value Momentum Index. Under normal circumstances, the fund seeks to achieve its investment objective by investing at least 80% of its assets in securities in the index. The index is designed to deliver exposure to equity securities of large-capitalization U.S. issuers within the Nasdaq US Large Cap 500 Index (the “parent index”) that have higher exposure to value and momentum factors, while also maintaining moderate index turnover and lower realized volatility than traditional capitalization-weighted indexes. |
General | |
Security Type | Exchange-Traded Fund |
Equity Style | Large Cap/Value |
Fixed Income Style | -- |
Broad Asset Class | US Equity |
Broad Category | Equity |
Category Name | Large Value |
Category Index | Russell 1000 Value TR USD |
Global Category Name | US Equity Large Cap Value |
YCharts Categorization | US Large Cap Value |
YCharts Benchmark | Russell 1000 Value Total Return (^RLVTR) |
Prospectus Objective | Growth and Income |
Fund Owner Firm Name | Victory Capital |
Prospectus Benchmark Index | |
Nasdaq Victory US Value Momentum TR USD | 100.0% |
Broad Asset Class Benchmark Index | |
^SPXTR | 100.0% |
Manager Tenure | |
Lance Humphrey | 5.35 yrs |
Mannik Dhillon | 3.75 yrs |
Net Fund Flows Versus Category
1 Month
% Rank:
--
--
Category Low
--
Category High
1 Year
% Rank:
65
-68.40M
-6.415B
Category Low
13.81B
Category High
3 Months
% Rank:
--
--
Category Low
--
Category High
3 Years
% Rank:
--
--
Category Low
--
Category High
6 Months
% Rank:
--
--
Category Low
--
Category High
5 Years
% Rank:
--
--
Category Low
--
Category High
YTD
% Rank:
--
--
Category Low
--
Category High
10 Years
% Rank:
--
--
Category Low
--
Category High
As of February 28, 2023
Risk
Performance Versus Category
As of March 31, 2023. Returns for periods of 1 year and above are annualized.
Annual Total Returns Versus Peers
As of March 31, 2023.
Asset Allocation
Top 10 Holdings
Name | % Weight | Price | % Change |
---|---|---|---|
JM Smucker Co | 1.44% | 157.37 | -0.11% |
The Hershey Co | 1.27% | 254.41 | 0.44% |
Kellogg Co | 1.17% | 66.96 | 0.45% |
Amgen Inc | 1.16% | 241.81 | 0.13% |
General Mills Inc | 1.14% | 85.46 | 0.59% |
Merck & Co Inc | 1.13% | 106.39 | 0.44% |
Consolidated Edison Inc | 1.12% | 95.67 | 1.00% |
AbbVie Inc | 1.11% | 159.37 | 0.92% |
Bristol-Myers Squibb Co | 1.10% | 69.31 | 1.63% |
McKesson Corp | 1.09% | 356.05 | -0.48% |
News
Headline
Wire
Time (ET)
Basic Info
Investment Strategy | |
The investment seeks to provide investment results that closely correspond, before fees and expenses, to the performance of the Nasdaq Victory US Value Momentum Index. Under normal circumstances, the fund seeks to achieve its investment objective by investing at least 80% of its assets in securities in the index. The index is designed to deliver exposure to equity securities of large-capitalization U.S. issuers within the Nasdaq US Large Cap 500 Index (the “parent index”) that have higher exposure to value and momentum factors, while also maintaining moderate index turnover and lower realized volatility than traditional capitalization-weighted indexes. |
General | |
Security Type | Exchange-Traded Fund |
Equity Style | Large Cap/Value |
Fixed Income Style | -- |
Broad Asset Class | US Equity |
Broad Category | Equity |
Category Name | Large Value |
Category Index | Russell 1000 Value TR USD |
Global Category Name | US Equity Large Cap Value |
YCharts Categorization | US Large Cap Value |
YCharts Benchmark | Russell 1000 Value Total Return (^RLVTR) |
Prospectus Objective | Growth and Income |
Fund Owner Firm Name | Victory Capital |
Prospectus Benchmark Index | |
Nasdaq Victory US Value Momentum TR USD | 100.0% |
Broad Asset Class Benchmark Index | |
^SPXTR | 100.0% |
Manager Tenure | |
Lance Humphrey | 5.35 yrs |
Mannik Dhillon | 3.75 yrs |
Fundamentals
General | |
Distribution Yield | Upgrade |
Dividend Yield TTM (3-31-23) | 1.73% |
30-Day SEC Yield (2-28-23) | Upgrade |
7-Day SEC Yield | -- |
Number of Holdings | Upgrade |
Stock | |
Weighted Average PE Ratio | 13.91 |
Weighted Average Price to Sales Ratio | Upgrade |
Weighted Average Price to Book Ratio | Upgrade |
Weighted Median ROE | Upgrade |
Weighted Median ROA | Upgrade |
Forecasted Dividend Yield | Upgrade |
Forecasted PE Ratio | Upgrade |
Forecasted Price to Sales Ratio | Upgrade |
Forecasted Price to Book Ratio | Upgrade |
As of March 29, 2023
Fund Details
Key Dates | |
Inception Date | 10/24/2017 |
Last Annual Report Date | 6/30/2022 |
Last Prospectus Date | 11/1/2022 |
Attributes | |
Index Fund |
|
Inverse Fund | No |
Leveraged Fund | No |
Fund of Funds | No |
Currency Hedged Fund | No |
Synthetic Replication Fund | No |
Has Dividend Investment Plan | No |
Socially Responsible Fund | No |
News
Headline
Wire
Time (ET)