

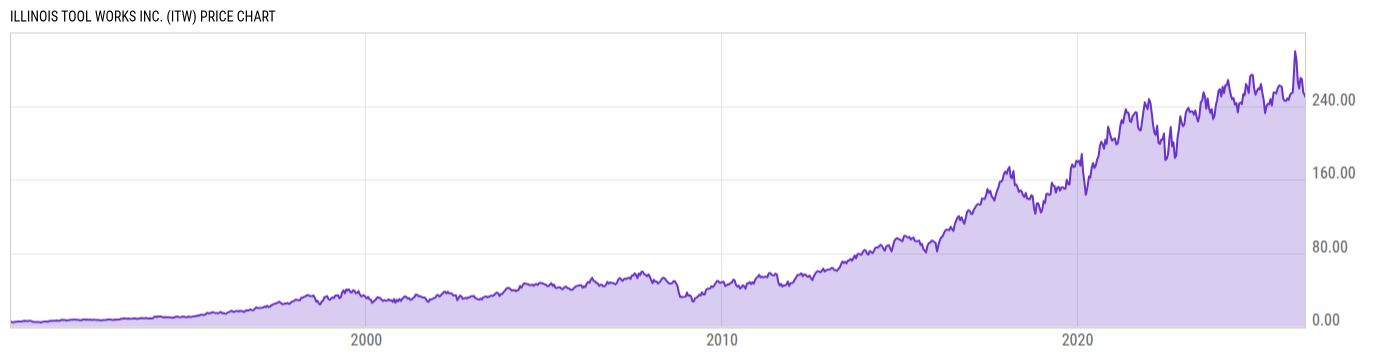
Illinois Tool Works Inc. (ITW)
250.46
-1.74
(-0.69%)
USD |
NYSE |
May 26, 16:00
250.37
-0.09
(-0.04%)
After-Hours: 20:00
Price Chart
Key Stats
| Price and Performance | |
|---|---|
| Market Cap | 72.06B |
| 52 Week High (Daily) | |
| 52 Week Low (Daily) | |
| All-Time High (Daily) | |
| Year to Date Total Returns (Daily) | |
| 1 Month Total Returns (Daily) | |
| 1 Year Total Returns (Daily) | 5.66% |
| Valuation | |
| PE Ratio | 23.25 |
| PE Ratio (Forward) | |
| PS Ratio | 4.493 |
| Price to Book Value | 22.32 |
| EV to EBITDA | |
| Dividend | |
|---|---|
| Dividend | 1.61 |
| Dividend Yield (Forward) | |
| Financials | |
| Revenue (5 Year Growth) | |
| Revenue (Quarterly YoY Growth) | |
| EPS Diluted (5 Year Growth) | |
| EPS Diluted (Quarterly YoY Growth) | |
| Debt to Equity Ratio | 2.833 |
| Return on Equity | |
| Return on Assets | |
| Risk | |
| Beta (5Y) | |
| Max Drawdown (5Y) | 28.04% |
Profile
| Illinois Tool Works, Inc. engages in the manufacture of industrial products and equipment. It operates through the following segments: Automotive OEM, Food Equipment, Test and Measurement and Electronics, Welding, Polymers and Fluids, Construction Products, and Specialty Products. The Automotive OEM segment produces components and fasteners for automotive-related applications. The Food Equipment segment supplies commercial food equipment and provides related services. The Test and Measurement and Electronics segment focuses on manufacturing equipment, consumables, and related software for testing and measuring of materials, structures, gases, and fluids. The Welding segment is involved in the arc of welding equipment, consumables, and accessories for a wide array of industrial and commercial applications. The Polymers and Fluids segment provides adhesives, sealants, lubrication and cutting fluids, janitorial and hygiene products, and fluids and polymers for auto aftermarket maintenance and appearance. The Construction Products segment refers to the construction of fastening systems and solutions. The Specialty Products segment represents the manufacturing of beverage packaging equipment and consumables, product coding and marking equipment and consumables, and appliance components and fasteners. The company was founded by Byron L. Smith in 1912 and is headquartered in Glenview, IL. |
| URL | http://www.itw.com |
| Investor Relations URL | https://investor.itw.com/overview/default.aspx |
| HQ State/Province | Illinois |
| Sector | Industrials |
| Industry | Machinery |
| Next Earnings Release | Jul. 29, 2026 (est.) |
| Last Earnings Release | Apr. 30, 2026 |
| Next Ex-Dividend Date | Jun. 30, 2026 |
| Last Ex-Dividend Date | Mar. 31, 2026 |