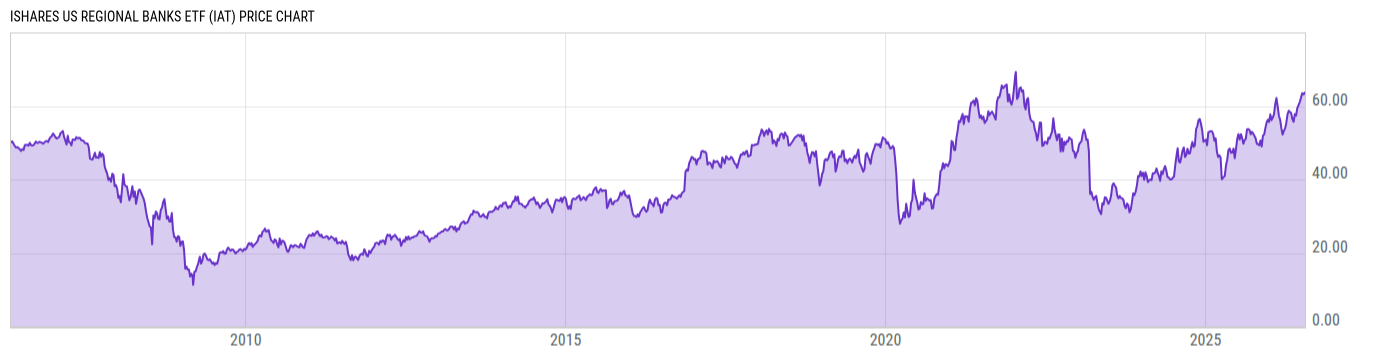
iShares US Regional Banks ETF (IAT)
35.21
+0.10
(+0.28%)
USD |
NYSEARCA |
Mar 28, 14:57
Key Stats
Expense Ratio | Discount or Premium to NAV | Total Assets Under Management | 30-Day Average Daily Volume |
---|---|---|---|
0.39% | 0.07% | 753.07M | 926641.6 |
Dividend Yield | Turnover Ratio | 1 Year Fund Level Flows | Max Drawdown (All) |
4.07% | 14.00% | -482.35M | Upgrade |
Basic Info
Investment Strategy | |
The investment seeks to track the investment results of the Dow Jones U.S. Select Regional Banks Index. The fund generally will invest at least 80% of its assets in the component securities of its underlying index and in investments that have economic characteristics that are substantially identical to the component securities of its underlying index. The index measures the performance of the regional bank sector of the U.S. equity market. The fund is non-diversified. |
General | |
Security Type | Exchange-Traded Fund |
Equity Style | Mid Cap/Value |
Fixed Income Style | -- |
Broad Asset Class | Sector Equity |
Broad Category | Equity |
Category Name | Financial |
Category Index | S&P 1500 Financials TR |
Global Category Name | Financials Sector Equity |
YCharts Categorization | Financials Equity |
YCharts Benchmark | S&P 1500 Financials (Sector) Total Return (^SP15FINSTR) |
Prospectus Objective | Specialty - Financial |
Fund Owner Firm Name | iShares |
Prospectus Benchmark Index | |
DJ US Select Regional Banks TR USD | 100.0% |
Broad Asset Class Benchmark Index | |
^MSWNTR | 100.0% |
Manager Tenure | |
Greg Savage | 15.17 yrs |
Jennifer Hsui | 10.50 yrs |
Paul Whitehead | 1.16 yrs |
Net Fund Flows Versus Category
1 Month
% Rank:
--
--
Category Low
--
Category High
1 Year
% Rank:
92
-482.35M
-8.898B
Category Low
804.86M
Category High
3 Months
% Rank:
--
--
Category Low
--
Category High
3 Years
% Rank:
--
--
Category Low
--
Category High
6 Months
% Rank:
--
--
Category Low
--
Category High
5 Years
% Rank:
--
--
Category Low
--
Category High
YTD
% Rank:
--
--
Category Low
--
Category High
10 Years
% Rank:
--
--
Category Low
--
Category High
As of February 28, 2023
Risk
Performance Versus Category
As of March 27, 2023. Returns for periods of 1 year and above are annualized.
Annual Total Returns Versus Peers
As of March 27, 2023.
Asset Allocation
Top 10 Holdings
Name | % Weight | Price | % Change |
---|---|---|---|
PNC Financial Services Group Inc | 13.78% | 126.73 | 1.37% |
U.S. Bancorp | 13.46% | 35.24 | 1.06% |
Truist Financial Corp | 12.08% | 33.31 | 0.70% |
M&T Bank Corp | 5.38% | 118.86 | 0.79% |
Regions Financial Corp | 4.65% | 18.21 | -0.27% |
Fifth Third Bancorp | 4.53% | 26.30 | 0.15% |
Huntington Bancshares Inc | 4.33% | 11.04 | -0.72% |
Citizens Financial Group Inc | 4.26% | 30.62 | 0.46% |
KeyCorp | 3.08% | 12.33 | -1.28% |
First Horizon Corp | 2.50% | 17.22 | -0.26% |
News
Headline
Wire
Time (ET)
SA Breaking News
03/22 13:08
SA Breaking News
03/14 15:13
SA Breaking News
01/23 16:24
SA Breaking News
10/19 10:33
SA Breaking News
06/10 13:48
SA Breaking News
06/01 11:08
Basic Info
Investment Strategy | |
The investment seeks to track the investment results of the Dow Jones U.S. Select Regional Banks Index. The fund generally will invest at least 80% of its assets in the component securities of its underlying index and in investments that have economic characteristics that are substantially identical to the component securities of its underlying index. The index measures the performance of the regional bank sector of the U.S. equity market. The fund is non-diversified. |
General | |
Security Type | Exchange-Traded Fund |
Equity Style | Mid Cap/Value |
Fixed Income Style | -- |
Broad Asset Class | Sector Equity |
Broad Category | Equity |
Category Name | Financial |
Category Index | S&P 1500 Financials TR |
Global Category Name | Financials Sector Equity |
YCharts Categorization | Financials Equity |
YCharts Benchmark | S&P 1500 Financials (Sector) Total Return (^SP15FINSTR) |
Prospectus Objective | Specialty - Financial |
Fund Owner Firm Name | iShares |
Prospectus Benchmark Index | |
DJ US Select Regional Banks TR USD | 100.0% |
Broad Asset Class Benchmark Index | |
^MSWNTR | 100.0% |
Manager Tenure | |
Greg Savage | 15.17 yrs |
Jennifer Hsui | 10.50 yrs |
Paul Whitehead | 1.16 yrs |
Fundamentals
General | |
Distribution Yield | Upgrade |
Dividend Yield TTM (3-28-23) | 4.07% |
30-Day SEC Yield (2-28-23) | Upgrade |
7-Day SEC Yield | -- |
Number of Holdings | Upgrade |
Stock | |
Weighted Average PE Ratio | 11.21 |
Weighted Average Price to Sales Ratio | Upgrade |
Weighted Average Price to Book Ratio | Upgrade |
Weighted Median ROE | Upgrade |
Weighted Median ROA | Upgrade |
Forecasted Dividend Yield | Upgrade |
Forecasted PE Ratio | Upgrade |
Forecasted Price to Sales Ratio | Upgrade |
Forecasted Price to Book Ratio | Upgrade |
As of March 24, 2023
Fund Details
Key Dates | |
Inception Date | 5/1/2006 |
Last Annual Report Date | 3/31/2022 |
Last Prospectus Date | 8/1/2022 |
Attributes | |
Index Fund |
|
Inverse Fund | No |
Leveraged Fund | No |
Fund of Funds | No |
Currency Hedged Fund | No |
Synthetic Replication Fund | No |
Has Dividend Investment Plan | No |
Socially Responsible Fund | No |
News
Headline
Wire
Time (ET)
SA Breaking News
03/22 13:08
SA Breaking News
03/14 15:13
SA Breaking News
01/23 16:24
SA Breaking News
10/19 10:33
SA Breaking News
06/10 13:48
SA Breaking News
06/01 11:08