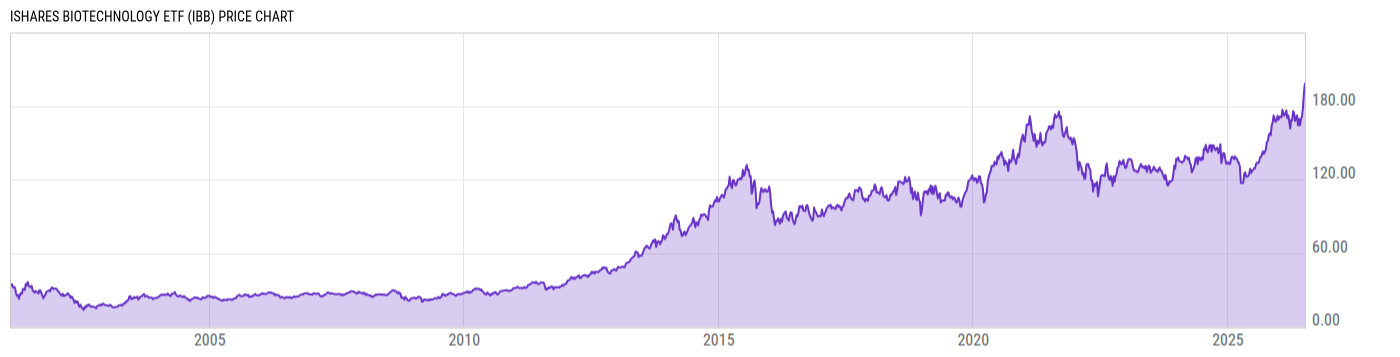
iShares Nasdaq Biotechnology ETF (IBB)
161.71
-0.16 (-0.10%)
USD |
Jan 15, 20:00
Price Chart
Key Stats
Customize
Expense Ratio | Discount or Premium to NAV | Total Assets Under Management | 30-Day Average Daily Volume |
---|---|---|---|
0.46% | 0.05% | 10.87B | 2.578M |
Dividend Yield | Turnover Ratio | 1 Year Fund Level Flows | Max Drawdown (All) |
0.19% | 29.00% | 990.96M | Upgrade |
Basic Info
Investment Strategy | |
The investment seeks to track the investment results of the NASDAQ Biotechnology Index, which contains securities of companies listed on NASDAQ that are classified according to the Industry Classification Benchmark as either biotechnology or pharmaceuticals and that also meet other eligibility criteria determined by Nasdaq, Inc. The fund generally invests at least 90% of its assets in securities of the index and in depositary receipts representing securities of the index. It may invest the remainder of its assets in certain futures, options and swap contracts, cash and cash equivalents. It is non-diversified. |
General | |
Security Type | Exchange-Traded Fund |
Equity Style | Mid Cap/Growth |
Fixed Income Style | -- |
Broad Asset Class | Sector Equity |
Broad Category | Equity |
Category Name | Health |
Category Index | S&P 1500 Health Care TR |
Prospectus Objective | Specialty - Technology |
Fund Owner Firm Name | iShares |
Prospectus Benchmark Index | |
NASDAQ Biotechnology TR USD | 100.0% |
Broad Asset Class Benchmark Index | |
^MSWNTR | 100.0% |
Manager Tenure | |
Greg Savage | 13.01 yrs |
Jennifer Hsui | 8.42 yrs |
Alan Mason | 4.72 yrs |
Amy Whitelaw | 2.42 yrs |
Rachel Aguirre | 2.42 yrs |
Net Fund Flows Versus Category
1 Month
% Rank:
--
--
Category Low
--
Category High
1 Year
% Rank:
8
990.96M
-4.447B
Category Low
5.239B
Category High
3 Months
% Rank:
--
--
Category Low
--
Category High
3 Years
% Rank:
--
--
Category Low
--
Category High
6 Months
% Rank:
--
--
Category Low
--
Category High
5 Years
% Rank:
--
--
Category Low
--
Category High
YTD
% Rank:
--
--
Category Low
--
Category High
10 Years
% Rank:
--
--
Category Low
--
Category High
As of December 31, 2020
Performance Versus Category
As of January 15, 2021. Returns for periods of 1 year and above are annualized.
Annual Total Returns Versus Peers
Edit comparables
As of January 15, 2021.
Asset Allocation
Top 10 Holdings
Name | % Weight | Price | % Change |
---|---|---|---|
Amgen Inc | 7.89% | 245.49 | 1.58% |
Gilead Sciences Inc | 6.19% | 63.33 | 1.49% |
Vertex Pharmaceuticals Inc | 4.66% | 225.55 | -0.25% |
Regeneron Pharmaceuticals Inc | 4.30% | 517.93 | 0.00% |
Illumina Inc | 4.17% | 376.35 | 1.43% |
Moderna Inc | 4.07% | 129.65 | -0.05% |
Biogen Inc | 3.42% | 275.84 | -1.59% |
Alexion Pharmaceuticals Inc | 2.72% | 156.70 | 0.03% |
Seagen Inc Ordinary Shares | 2.52% | 185.75 | 5.62% |
AstraZeneca PLC ADR | 1.99% | 51.34 | 0.10% |
News
Headline
Wire
Time (ET)
MT Newswires
01/15 07:42
MT Newswires
01/14 07:48
Basic Info
Investment Strategy | |
The investment seeks to track the investment results of the NASDAQ Biotechnology Index, which contains securities of companies listed on NASDAQ that are classified according to the Industry Classification Benchmark as either biotechnology or pharmaceuticals and that also meet other eligibility criteria determined by Nasdaq, Inc. The fund generally invests at least 90% of its assets in securities of the index and in depositary receipts representing securities of the index. It may invest the remainder of its assets in certain futures, options and swap contracts, cash and cash equivalents. It is non-diversified. |
General | |
Security Type | Exchange-Traded Fund |
Equity Style | Mid Cap/Growth |
Fixed Income Style | -- |
Broad Asset Class | Sector Equity |
Broad Category | Equity |
Category Name | Health |
Category Index | S&P 1500 Health Care TR |
Prospectus Objective | Specialty - Technology |
Fund Owner Firm Name | iShares |
Prospectus Benchmark Index | |
NASDAQ Biotechnology TR USD | 100.0% |
Broad Asset Class Benchmark Index | |
^MSWNTR | 100.0% |
Manager Tenure | |
Greg Savage | 13.01 yrs |
Jennifer Hsui | 8.42 yrs |
Alan Mason | 4.72 yrs |
Amy Whitelaw | 2.42 yrs |
Rachel Aguirre | 2.42 yrs |
Fundamentals
General | |
Distribution Yield | Upgrade |
Dividend Yield TTM (1-15-21) | 0.19% |
30-Day SEC Yield (3-31-20) | Upgrade |
7-Day SEC Yield | -- |
Number of Holdings | Upgrade |
Stock | |
Weighted Average PE Ratio | 22.31 |
Weighted Average Price to Sales Ratio | Upgrade |
Weighted Average Price to Book Ratio | Upgrade |
Weighted Median ROE | Upgrade |
Weighted Median ROA | Upgrade |
Forecasted Dividend Yield | Upgrade |
Forecasted PE Ratio | Upgrade |
Forecasted Price to Sales Ratio | Upgrade |
Forecasted Price to Book Ratio | Upgrade |
As of January 14, 2021
Growth Estimates
Fund Details
Key Dates | |
Inception Date | 2/5/2001 |
Last Annual Report Date | 3/31/2020 |
Last Prospectus Date | 8/17/2020 |
Attributes | |
Enhanced Index Fund | No |
Index Fund |
|
Inverse Fund | No |
Leveraged Fund | No |
Fund of Funds | No |
Currency Hedged Fund | No |
Synthetic Replication Fund | No |
Has Dividend Investment Plan |
|
Socially Responsible Fund | No |
News
Headline
Wire
Time (ET)
MT Newswires
01/15 07:42
MT Newswires
01/14 07:48