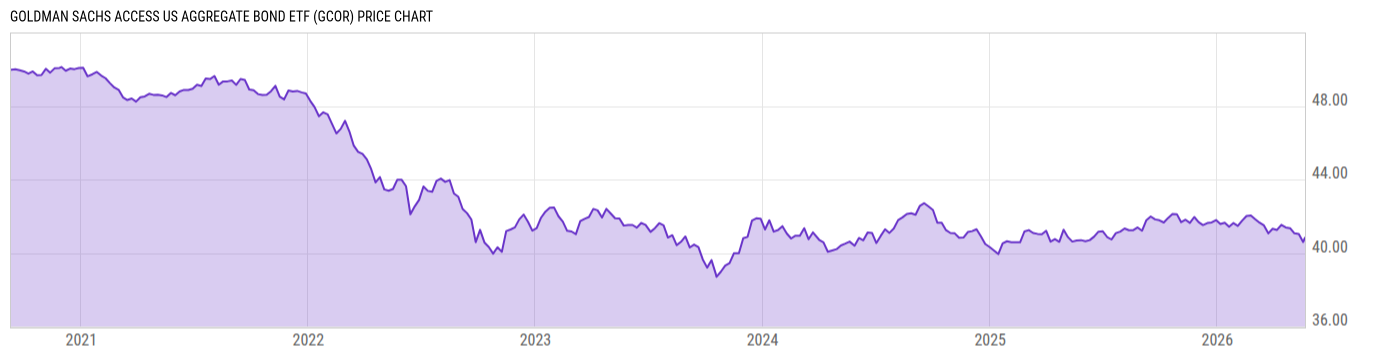
Key Stats

Expense Ratio Discount or Premium to NAV Total Assets Under Management 30-Day Average Daily Volume
0.14% 0.16% 463.22M 70250.47
Dividend Yield Turnover Ratio 1 Year Fund Level Flows Max Drawdown (All)
2.29% 522.0% 207.38M Upgrade

Basic Info

Investment Strategy
The investment seeks to provide investment results that closely correspond, before fees and expenses, to the performance of the FTSE Goldman Sachs US Broad Bond Market Index. The fund seeks to achieve its investment objective by investing at least 80% of its assets (exclusive of collateral held from securities lending) in securities included in its underlying index. The index is a rules-based index that is designed to measure the performance of investment grade, U.S. dollar (“USD”)-denominated bonds issued in the United States that meet certain liquidity and fundamental screening criteria.
General
Security Type Exchange-Traded Fund
Equity Style --
Fixed Income Style High Quality/Moderate Sensitivity
Broad Asset Class Taxable Bond
Broad Category Fixed Income
Category Name Intermediate Core Bond
Category Index Bloomberg US Agg Bond TR USD
Global Category Name US Fixed Income
YCharts Categorization US Fixed Income
YCharts Benchmark Bloomberg US Aggregate (^BBUSATR)
Prospectus Objective Income
Fund Owner Firm Name Goldman Sachs
Prospectus Benchmark Index
FTSE Goldman Sachs US BB Mkt TR USD 100.0%
Broad Asset Class Benchmark Index
^BBUSATR 100.0%
Manager Tenure
David Westbrook 2.48 yrs
Todd Henry 1.17 yrs

Net Fund Flows Versus Category

View Net Fund Flows. Upgrade now.
1M
3M
6M
YTD
1Y
3Y
5Y
10Y
 
80.00B
60.00B
40.00B
20.00B
0
-20.00B
1 Month
% Rank: --
-- Category Low
-- Category High
1 Year
% Rank: 28
207.38M
-3.131B Category Low
14.37B Category High
3 Months
% Rank: --
-- Category Low
-- Category High
3 Years
% Rank: --
-- Category Low
-- Category High
6 Months
% Rank: --
-- Category Low
-- Category High
5 Years
% Rank: --
-- Category Low
-- Category High
YTD
% Rank: --
-- Category Low
-- Category High
10 Years
% Rank: --
-- Category Low
-- Category High
As of February 28, 2023

Performance Versus Category

 
20%
15%
10%
5%
0
View Category Returns. Upgrade now.
Name
1M
3M
YTD
1Y
3Y
5Y
10Y
15Y
Total Return (Price)
--
--
--
--
--
--
--
--
Total Return (NAV)
--
--
--
--
--
--
--
--
Category Rtn. (NAV)
--
--
--
--
--
--
--
--
% Rank in Cat (NAV)
--
--
--
--
--
--
--
--
As of March 29, 2023. Returns for periods of 1 year and above are annualized.

Annual Total Returns Versus Peers

Loading chart...
Name
2016
2017
2018
2019
2020
2021
2022
YTD
--
--
--
--
--
-1.88%
-13.83%
2.72%
2.65%
3.54%
0.01%
8.72%
7.51%
-1.54%
-13.01%
2.29%
2.53%
3.57%
-0.11%
8.84%
7.71%
-1.86%
-13.11%
2.58%
--
--
0.08%
8.22%
7.17%
-2.19%
-12.90%
2.44%
--
--
--
--
--
-1.79%
-14.61%
3.03%
--
--
--
--
--
-1.46%
-13.29%
2.49%
As of March 29, 2023.

Fundamentals

General
Distribution Yield Upgrade
Dividend Yield TTM (3-30-23) 2.29%
30-Day SEC Yield (2-28-23) Upgrade
7-Day SEC Yield --
Number of Holdings Upgrade
Bond
Current Yield 2.71%
Yield to Maturity Upgrade
Effective Duration Upgrade
Average Coupon Upgrade
Average Credit Score Upgrade
Average Price Upgrade
As of March 29, 2023

Asset Allocation

As of March 29, 2023.
Type % Net % Long % Short
Cash 11.61% Upgrade Upgrade
Stock 0.00% Upgrade Upgrade
Bond 88.32% Upgrade Upgrade
Convertible 0.07% Upgrade Upgrade
Preferred 0.00% Upgrade Upgrade
Other 0.00% Upgrade Upgrade

Top 10 Holdings

Name % Weight Price % Change
Goldman Sachs FS Government Instl 11.61% 1.00 0.00%
United States Treasury Notes 0.25%
6.21% -- --
United States Treasury Notes 0.25%
6.03% -- --
United States Treasury Notes 2.5%
3.56% -- --
United States Treasury Notes 2%
3.39% -- --
United States Treasury Bonds 2.75%
2.45% -- --
United States Treasury Bonds 2.5%
2.03% -- --
United States Treasury Notes 2.75%
1.85% -- --
Federal Home Loan Mortgage Corporation 2%
1.69% -- --
Federal National Mortgage Association 3%
1.67% -- --

News

Headline
Wire
Time (ET)
No Data Available

Basic Info

Investment Strategy
The investment seeks to provide investment results that closely correspond, before fees and expenses, to the performance of the FTSE Goldman Sachs US Broad Bond Market Index. The fund seeks to achieve its investment objective by investing at least 80% of its assets (exclusive of collateral held from securities lending) in securities included in its underlying index. The index is a rules-based index that is designed to measure the performance of investment grade, U.S. dollar (“USD”)-denominated bonds issued in the United States that meet certain liquidity and fundamental screening criteria.
General
Security Type Exchange-Traded Fund
Equity Style --
Fixed Income Style High Quality/Moderate Sensitivity
Broad Asset Class Taxable Bond
Broad Category Fixed Income
Category Name Intermediate Core Bond
Category Index Bloomberg US Agg Bond TR USD
Global Category Name US Fixed Income
YCharts Categorization US Fixed Income
YCharts Benchmark Bloomberg US Aggregate (^BBUSATR)
Prospectus Objective Income
Fund Owner Firm Name Goldman Sachs
Prospectus Benchmark Index
FTSE Goldman Sachs US BB Mkt TR USD 100.0%
Broad Asset Class Benchmark Index
^BBUSATR 100.0%
Manager Tenure
David Westbrook 2.48 yrs
Todd Henry 1.17 yrs

Fundamentals

General
Distribution Yield Upgrade
Dividend Yield TTM (3-30-23) 2.29%
30-Day SEC Yield (2-28-23) Upgrade
7-Day SEC Yield --
Number of Holdings Upgrade
Bond
Current Yield 2.71%
Yield to Maturity Upgrade
Effective Duration Upgrade
Average Coupon Upgrade
Average Credit Score Upgrade
Average Price Upgrade
As of March 29, 2023

Fund Details

Key Dates
Inception Date 9/8/2020
Last Annual Report Date 8/31/2022
Last Prospectus Date 12/29/2022
Attributes
Index Fund Yes
Inverse Fund No
Leveraged Fund No
Fund of Funds No
Currency Hedged Fund No
Synthetic Replication Fund No
Has Dividend Investment Plan No
Socially Responsible Fund No

News

Headline
Wire
Time (ET)
No Data Available

Top Portfolio Holders

0 of 0