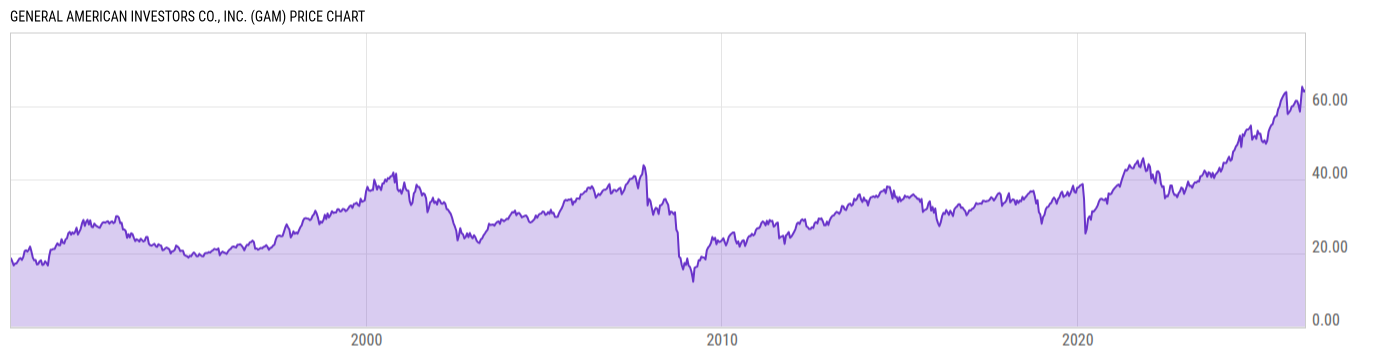
General American Investors (GAM)
36.56
+0.18 +0.49%
NYSE
Dec 9, 20:00
Delayed 2m
USD
Key Stats
Expense Ratio | 1.20% |
Total Assets Under Management | 1.029B |
Share Class Assets Under Management | 1.029B |
30-Day Average Daily Volume | 28449.47 |
Net Asset Value | 42.14 |
Discount or Premium to NAV | -13.24% |
Turnover Ratio | 23.00% |
1 Year Fund Level Flows | -- |
View All GAM News
News
-
WireHeadlineTime (ET)
-
Yahoo11/29 12:50
-
SA Breaking News11/06 18:33
-
Business Wire11/06 16:25
-
Yahoo10/28 13:24
-
Business Wire10/25 16:25
-
Business Wire08/02 16:15
-
Business Wire07/24 16:25
-
Business Wire05/01 16:25
-
Business Wire04/24 16:25
-
Business Wire02/20 16:25
Performance & Returns
Total Return (Price) | Total Return (NAV) | Cat. Total Return (NAV) | % Rank in Cat. (NAV) | |
---|---|---|---|---|
1M | 1.62% | 1.77% | 1.23% | 34 |
3M | 6.52% | 4.53% | 4.62% | 17 |
6M | 14.13% | 9.97% | 9.11% | 67 |
YTD | 36.60% | 29.48% | 24.83% | 17 |
1Y | 23.33% | 18.57% | 15.71% | 17 |
3Y | 11.88% | 9.00% | 11.84% | 84 |
5Y | 7.22% | 6.14% | 8.47% | 84 |
10Y | 11.03% | 9.85% | 11.59% | 84 |
15Y | 7.50% | 6.86% | 7.50% | 84 |
20Y | 6.98% | 6.64% | 5.09% | 50 |
Asset Allocation
Type | % Net | % Long | % Short |
---|---|---|---|
Cash | 10.88% | 10.88% | 0.00% |
Stock | 104.0% | 104.0% | 0.00% |
Bond | 0.00% | 0.00% | 0.00% |
Convertible | 0.00% | 0.00% | 0.00% |
Preferred | -17.98% | 0.00% | 17.98% |
Other | 3.14% | 3.59% | 0.45% |
Region Exposure
Americas | 86.82% |
North America | 86.82% |
Latin America | 0.00% |
Greater Europe | 13.18% |
United Kingdom | 4.97% |
Europe Developed | 8.21% |
Europe Emerging | 0.00% |
Africa/Middle East | 0.00% |
Greater Asia | 0.00% |
Japan | 0.00% |
Australasia | 0.00% |
Asia Developed | 0.00% |
Asia Emerging | 0.00% |
Market Classification | |
% Developed Markets | 100.0% |
% Emerging Markets | 1.34% |
Stock Sector Exposure
Basic Materials | 2.13% |
Communication Services | 3.19% |
Consumer Cyclical | 13.93% |
Consumer Defensive | 12.93% |
Energy | 5.65% |
Financial Services | 21.23% |
Healthcare | 6.61% |
Industrials | 11.08% |
Real Estate | 0.00% |
Technology | 23.25% |
Utilities | 0.00% |
Stock Market Capitalization
Giant | 42.88% |
Large | 29.07% |
Medium | 20.52% |
Small | 5.65% |
Micro | 1.88% |
Stock Style Exposure
Large Cap Value | 22.19% |
Large Cap Blend | 22.69% |
Large Cap Growth | 27.05% |
Mid Cap Value | 6.49% |
Mid Cap Blend | 6.95% |
Mid Cap Growth | 7.71% |
Small Cap Value | 3.04% |
Small Cap Blend | 2.08% |
Small Cap Growth | 1.80% |
View More Holdings
As of June 30, 2019
Top 10 Holdings
Symbol | Name | % Weight | Price | % Chg |
---|---|---|---|---|
-- | Preferred Stock | -17.98% | -- | -- |
TJX | TJX Companies Inc | 5.28% | 60.36 | +0.87% |
RSG | Republic Services Inc Class A | 4.90% | 88.68 | -0.10% |
MSFT | Microsoft Corp | 4.57% | 151.36 | -0.26% |
ACGL | Arch Capital Group Ltd | 3.79% | 41.45 | +0.70% |
GOOGL | Alphabet Inc A | 3.63% | 1342.99 | +0.27% |
-- | Nestle S A | 3.38% | -- | -- |
ASML | ASML Holding NV | 3.36% | -- | -- |
BRK.A | Berkshire Hathaway Inc A | 3.31% | 331904.0 | -0.52% |
AMZN | Amazon.com Inc | 3.22% | 1749.51 | -0.12% |
Advertisement
Basic Info
Investment Strategy | |
---|---|
To achieve long-term capital appreciation, with lesser emphasis placed on current income. The Company invests principally in common stocks believed by its management to have better than average growth potential. Normally, a substantially fully invested position in equities is maintained. | |
General | |
Security Type | Closed-End Fund |
Equity Style | Large Cap/Blend |
Fixed Income Style | -- |
Broad Asset Class | US Equity |
Broad Category | Equity |
Category Name | Large Blend |
Prospectus Objective | Growth |
Fund Owner Firm Name | General American Investors Company Inc |
Benchmark Index | |
S&P 500 TR USD | 100.0% |
Reports | |
One Page Report | Download |
Manager Info
Name | Tenure |
---|---|
Jeffrey Priest | 6.25 yrs |
Net Fund Flows
1M | -- |
3M | -- |
6M | -- |
YTD | -- |
1Y | -- |
3Y | -- |
5Y | -- |
10Y | -- |
Risk Info
Beta (5Y) | 1.184 |
Max Drawdown (All) | 66.58% |
Historical Sharpe Ratio (10Y) | 0.7987 |
Historical Sortino (All) | 0.4821 |
30-Day Rolling Volatility | 9.05% |
Daily Value at Risk (VaR) 1% (All) | 3.44% |
Monthly Value at Risk (VaR) 1% (All) | 15.55% |
Fundamentals
Dividend Yield TTM (12-9-19) | 1.01% |
30-Day SEC Yield | -- |
7-Day SEC Yield | -- |
Weighted Average PE Ratio | 19.01 |
Weighted Average Price to Sales Ratio | 1.612 |
Weighted Average Price to Book Ratio | 2.549 |
Weighted Median ROE | 22.86% |
Weighted Median ROA | 6.99% |
Forecasted Dividend Yield | 1.69% |
Forecasted PE Ratio | 17.05 |
Forecasted Price to Sales Ratio | 1.373 |
Forecasted Price to Book Ratio | 2.452 |
Number of Holdings | 67 |
Growth Estimates
Forecasted 5 Yr Earnings Growth | 11.00% |
Forecasted Book Value Growth | 3.93% |
Forecasted Cash Flow Growth | 19.58% |
Forecasted Earnings Growth | -0.34% |
Forecasted Revenue Growth | 8.98% |
Attributes
Key Dates | |
---|---|
Inception Date | 2/1/1927 |
Termination Date | |
Last Annual Report Date | 12/31/2018 |
Last Prospectus Date | |
Attributes | |
Exchange Traded Share | No |
Exchange Traded Note | No |
Enhanced Index Fund | No |
Fixed Distribution Fund | No |
High-Net Worth Individual Fund | No |
Index Fund | No |
Inverse Fund | No |
Leveraged Fund | Yes |
Fund of Funds | No |
Currency Hedged Fund | No |
Synthetic Replication Fund | No |
Has Dividend Investment Plan | Yes |
Socially Responsible Fund | No |
General Availability | |
Available for Insurance Product | No |
Available for Retirement Plan | No |
Available for RRSP | No |
Advertisement