

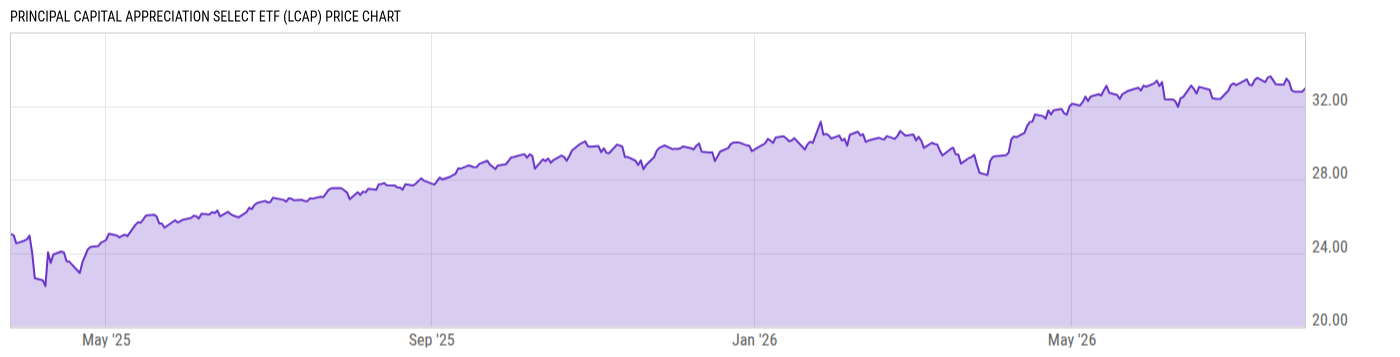
Principal Capital Appreciation Select ETF (LCAP)
32.90
+0.12
(+0.37%)
USD |
BATS |
Jul 28, 16:00
32.95
+0.05
(+0.15%)
Pre-Market: 20:00
Price Chart
Key Stats
| Net Expense Ratio | Discount or Premium to NAV | Total Assets Under Management | 30-Day Average Daily Volume |
|---|---|---|---|
| 0.29% | 0.23% | 1.813B | 54789.87 |
| Weighted Average Dividend Yield | Turnover Ratio (Generic) | 1 Year Fund Level Flows | Max Drawdown (Since Inception) |
| 0.75% | -- | 1.757B |
Basic Info
| Investment Strategy | |
| The Fund seeks to provide long-term growth of capital. The Fund invests in equity securities of US companies with any market capitalization, but it has a greater exposure to large market capitalization companies. Most of the investments typically include companies with a market capitalization range over $10 billion. |
| General | |
| Security Type | Exchange-Traded Fund |
| Equity Style | Large Cap Core |
| Broad Asset Class | US Equity |
| Broad Category | Equity |
| Global Peer Group | Equity US |
| Peer Group | Large-Cap Core Funds |
| Global Macro | Equity North America |
| US Macro | Large-Cap Funds |
| YCharts Categorization | -- |
| YCharts Benchmark | -- |
| Prospectus Objective | Growth & Income Funds |
| Fund Owner Firm Name | Principal |
| Broad Asset Class Benchmark Index | |
| ^SPXTR | 100.0% |
Performance Versus Peer Group
Annual Total Returns Versus Peers
As of July 29, 2026.
Asset Allocation
As of June 30, 2026.
| Type | % Net |
|---|---|
| Cash | 1.23% |
| Stock | 98.28% |
| Bond | 1.00% |
| Convertible | 0.00% |
| Preferred | 0.00% |
| Other | -0.51% |
Basic Info
| Investment Strategy | |
| The Fund seeks to provide long-term growth of capital. The Fund invests in equity securities of US companies with any market capitalization, but it has a greater exposure to large market capitalization companies. Most of the investments typically include companies with a market capitalization range over $10 billion. |
| General | |
| Security Type | Exchange-Traded Fund |
| Equity Style | Large Cap Core |
| Broad Asset Class | US Equity |
| Broad Category | Equity |
| Global Peer Group | Equity US |
| Peer Group | Large-Cap Core Funds |
| Global Macro | Equity North America |
| US Macro | Large-Cap Funds |
| YCharts Categorization | -- |
| YCharts Benchmark | -- |
| Prospectus Objective | Growth & Income Funds |
| Fund Owner Firm Name | Principal |
| Broad Asset Class Benchmark Index | |
| ^SPXTR | 100.0% |