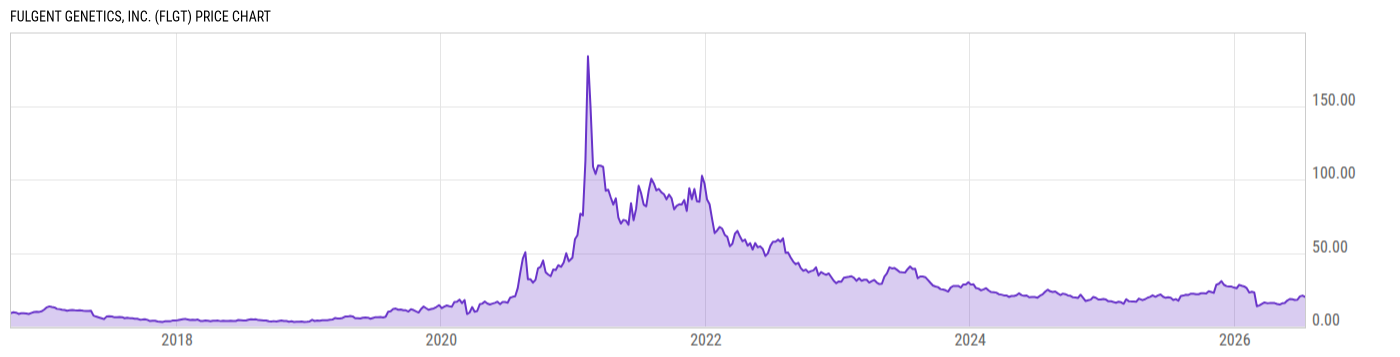
Fulgent Genetics Inc (FLGT)
53.26
+0.85 (+1.62%)
USD |
NASDAQ |
Aug 15, 16:00
53.20
-0.06 (-0.11%)
After-Hours: 20:00
Price Chart
Key Stats
Price and Performance | |
---|---|
Market Cap | 1.612B |
52 Week High (Daily) | Upgrade |
52 Week Low (Daily) | Upgrade |
All-Time High (Daily) | Upgrade |
Year to Date Total Returns (Daily) | Upgrade |
1 Month Total Returns (Daily) | Upgrade |
1 Year Total Returns (Daily) | -43.47% |
Valuation | |
PE Ratio | 4.237 |
PE Ratio (Forward) | Upgrade |
PS Ratio | 1.796 |
Price to Book Value | 1.235 |
EV to EBITDA | Upgrade |
Dividend | |
---|---|
Dividend | -- |
Dividend Yield (Forward) | Upgrade |
Financials | |
Revenue (5 Year Growth) | Upgrade |
Revenue (Quarterly YoY Growth) | Upgrade |
EPS Diluted (5 Year Growth) | Upgrade |
EPS Diluted (Quarterly YoY Growth) | Upgrade |
Debt to Equity Ratio | 0.0159 |
Return on Equity | Upgrade |
Return on Assets | Upgrade |
Risk | |
Beta (5Y) | Upgrade |
Max Drawdown (5Y) | 77.98% |
News
Headline
Wire
Time (ET)
Globe Newswire
08/15 21:00
Globe Newswire
08/10 21:00
Globe Newswire
08/10 02:48
Events
DATE | TIME | TYPE | PERIOD | REPORTED EPS |
ESTIMATED EPS |
SURPRISE | |
11/09/2022* | -- | Results | Q3 2022 | -- | 0.31 | -- | |
11/09/2022* | 16:30 EST | Earnings Call | Q3 2022 | -- | -- | -- | |
08/04/2022 | -- | Results | Q2 2022 | 0.78 | 0.73 | 6.85% | |
08/04/2022 | 16:30 EST | Earnings Call | Q2 2022 | -- | -- | -- | |
05/03/2022 | -- | Results | Q1 2022 | 5.08 | 3.86 | 31.61% | |
05/03/2022 | 16:30 EST | Earnings Call | Q1 2022 | -- | -- | -- | |
02/23/2022 | -- | Results | Q4 2021 | 3.48 | 2.67 | 30.58% | |
02/23/2022 | 16:30 EST | Earnings Call | Q4 2021 | -- | -- | -- |
*Estimated Date/Time
Earnings
Profile
Edit
Fulgent Genetics Inc is a technology company that focuses on genetic testing to provide physicians with clinically actionable diagnostic information. Genetic testing offers the possibility of early identification of a disease or a genetic predisposition to disease and enhanced disease treatment and prognosis. Fulgent's product portfolio includes Genes & Panels, Known Mutation, Genomic Testing, Hereditary Cancer, Carrier Screening, Tumor Profiling, and Sequencing Service. Its customers are categorized as Insurance; Institutional, which includes hospitals, medical institutions, laboratories, governmental bodies, municipalities, and large corporations; and Patients. The geographical segments are the United States, which generates the vast majority of the revenue; and Foreign. |
URL | https://www.fulgentgenetics.com |
Investor Relations URL | https://fulgentgenetics.gcs-web.com |
HQ State/Province | California |
Sector | Healthcare |
Industry | Diagnostics & Research |
Equity Style | Small Cap/Blend |
Next Earnings Release | Nov. 09, 2022 (est.) |
Last Earnings Release | Aug. 04, 2022 |
Next Ex-Dividend Date | N/A |
Last Ex-Dividend Date | N/A |
Analyst Coverage
Consensus Rating
|
|
Analyst Recommendation
|
Source: S&P Global
Dividends
Dividend Per Share (TTM) | -- |
2017
2018
2019
2020
2021
6.00%
4.00%
2.00%
|
|
Yield to Market | 0.00 |
Yield to Sector | 0.00 |
Yield to Industry | 0.00 |
Last Dividend Amt. | -- |
Dividend Frequency | -- |
Last Ex-Dividend Date | -- |
Yield (TTM) | 0.00% |
Forward Yield | -- |
Payout Ratio | 0.00% |
Cash Payout Ratio | 0.00% |
Consistent Payer (5Y) | No |
Consistent Growth (5Y) | No |
Risk Info
Total Returns Comparison
Annual Total Returns Versus Peers
As of August 15, 2022.
Fundamentals
Revenue (TTM) | 925.15M |
Total Expenses (TTM) | 397.39M |
Net Income (TTM) | 392.38M |
Total Assets (Quarterly) | 1.462B |
Total Liabilities (Quarterly) | 150.93M |
Shareholders Equity (Quarterly) | 1.305B |
Cash from Operations (TTM) | 428.82M |
Cash from Investing (TTM) | -388.06M |
Cash from Financing (TTM) | -1.921M |
Ratings
Profile
Edit
Fulgent Genetics Inc is a technology company that focuses on genetic testing to provide physicians with clinically actionable diagnostic information. Genetic testing offers the possibility of early identification of a disease or a genetic predisposition to disease and enhanced disease treatment and prognosis. Fulgent's product portfolio includes Genes & Panels, Known Mutation, Genomic Testing, Hereditary Cancer, Carrier Screening, Tumor Profiling, and Sequencing Service. Its customers are categorized as Insurance; Institutional, which includes hospitals, medical institutions, laboratories, governmental bodies, municipalities, and large corporations; and Patients. The geographical segments are the United States, which generates the vast majority of the revenue; and Foreign. |
URL | https://www.fulgentgenetics.com |
Investor Relations URL | https://fulgentgenetics.gcs-web.com |
HQ State/Province | California |
Sector | Healthcare |
Industry | Diagnostics & Research |
Equity Style | Small Cap/Blend |
Next Earnings Release | Nov. 09, 2022 (est.) |
Last Earnings Release | Aug. 04, 2022 |
Next Ex-Dividend Date | N/A |
Last Ex-Dividend Date | N/A |
Risk Info
Ownership
Insider Ownership Percentage | Upgrade |
Jul '20
Nov '20
Mar '21
80.00%
40.00%
10.00%
Analyst Coverage
Consensus Rating
|
|
Analyst Recommendation
|
Source: S&P Global
Other Resources
Whale Wisdom | 13F Filings |
Seeking Alpha | Call Transcripts |
Morningstar | Insider Trading |
Nasdaq | Institutional Ownership |
Nasdaq | Option Chain |
SEC | SEC Filings |
FLGT Tweets |