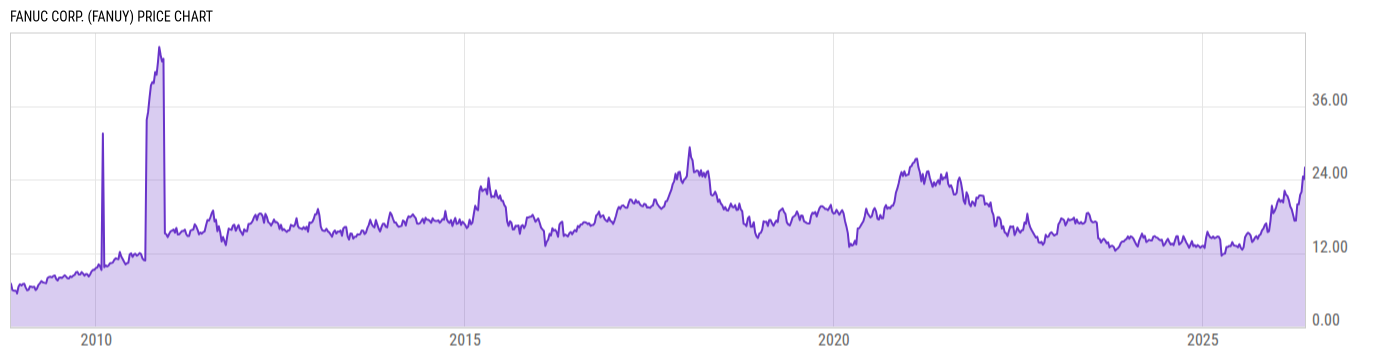
Fanuc Corp (FANUY)
17.95
+0.14
(+0.79%)
USD |
OTCM |
Mar 31, 16:00
Key Stats
Price and Performance | |
---|---|
Market Cap | 34.25B |
52 Week High (Daily) | Upgrade |
52 Week Low (Daily) | Upgrade |
All-Time High (Daily) | Upgrade |
Year to Date Total Returns (Daily) | Upgrade |
1 Month Total Returns (Daily) | Upgrade |
1 Year Total Returns (Daily) | 3.68% |
Valuation | |
PE Ratio | 27.11 |
PE Ratio (Forward) | Upgrade |
PS Ratio | 5.424 |
Price to Book Value | 2.836 |
EV to EBITDA | Upgrade |
Dividend | |
---|---|
Dividend | 0.1938 |
Dividend Yield (Forward) | Upgrade |
Financials | |
Revenue (5 Year Growth) | Upgrade |
Revenue (Quarterly YoY Growth) | Upgrade |
EPS Diluted (5 Year Growth) | Upgrade |
EPS Diluted (Quarterly YoY Growth) | Upgrade |
Debt to Equity Ratio | 0.00 |
Return on Equity | Upgrade |
Return on Assets | Upgrade |
Risk | |
Beta (5Y) | Upgrade |
Max Drawdown (5Y) | 59.31% |
News
Headline
Wire
Time (ET)
MT Newswires
10/28 06:52
Events
DATE | TIME | TYPE | PERIOD | REPORTED EPS |
ESTIMATED EPS |
SURPRISE | |
04/26/2023* | -- | Results | Q4 2023 | -- | -- | -- | |
04/26/2023* | -- | Earnings Call | Q4 2023 | -- | -- | -- | |
01/27/2023 | -- | Results | Q3 2023 | -- | -- | -- | |
11/09/2022 | -- | Results | Q2 2023 | -- | -- | -- | |
08/08/2022 | -- | Results | Q1 2023 | -- | -- | -- | |
04/26/2022 | -- | Earnings Call | Q4 2022 | -- | -- | -- | |
04/26/2022 | -- | Results | Q4 2022 | -- | -- | -- | |
01/26/2022 | -- | Results | Q3 2022 | -- | -- | -- |
*Estimated Date/Time
Earnings
Profile
Fanuc provides factory automation products, such as industrial robots, computerized numerical control systems, and compact machining centers (Robodrills) to mainly manufacturing companies globally. Fanuc had its beginnings as part of Fujitsu developing early numerical control systems and now commands the top global market share with its CNC systems and industrial robots. |
URL | http://www.fanuc.co.jp |
Investor Relations URL | https://fanuc.co.jp/en/ir/index.html |
HQ State/Province | N/A |
Sector | Industrials |
Industry | Specialty Industrial Machinery |
Equity Style | Large Cap/Growth |
Next Earnings Release | Apr. 26, 2023 (est.) |
Last Earnings Release | Jan. 27, 2023 |
Next Ex-Dividend Date | N/A |
Last Ex-Dividend Date | Sep. 29, 2022 |
Analyst Coverage
|
|
Low:--
High:--
|
|
Price Target Std Dev |
|
Price Target Upside (Daily) | Upgrade |
Price Target Num Estimates | Upgrade |
Consensus Rating
|
|
Analyst Recommendation
|
Source: S&P Global
Dividends
Dividend Per Share (TTM) | 0.388 |
2017
2018
2019
2020
2021
6.00%
4.00%
2.00%
|
|
Yield to Market | 0.7795 |
Yield to Sector | 0.2976 |
Yield to Industry | 0.3566 |
Last Dividend Amt. | 0.1938 |
Dividend Frequency | Semi-Annually |
Last Ex-Dividend Date | Sep. 29, 2022 |
Yield (TTM) | 1.08% |
Forward Yield | 2.06% |
Payout Ratio | 0.00% |
Cash Payout Ratio | -- |
Consistent Payer (5Y) |
|
Consistent Growth (5Y) | No |
Risk
Total Returns Comparison
Annual Total Returns Versus Peers
As of March 31, 2023.
Fundamentals
Revenue (TTM) | 6.333B |
Total Expenses (TTM) | 4.879B |
Net Income (TTM) | 1.267B |
Total Assets (Quarterly) | 14.06B |
Total Liabilities (Quarterly) | 1.902B |
Shareholders Equity (Quarterly) | 12.07B |
2017
2018
2019
2020
2021
4.00
2.00
1.00
Ratings
Profile
Fanuc provides factory automation products, such as industrial robots, computerized numerical control systems, and compact machining centers (Robodrills) to mainly manufacturing companies globally. Fanuc had its beginnings as part of Fujitsu developing early numerical control systems and now commands the top global market share with its CNC systems and industrial robots. |
URL | http://www.fanuc.co.jp |
Investor Relations URL | https://fanuc.co.jp/en/ir/index.html |
HQ State/Province | N/A |
Sector | Industrials |
Industry | Specialty Industrial Machinery |
Equity Style | Large Cap/Growth |
Next Earnings Release | Apr. 26, 2023 (est.) |
Last Earnings Release | Jan. 27, 2023 |
Next Ex-Dividend Date | N/A |
Last Ex-Dividend Date | Sep. 29, 2022 |
Ownership
Insider Ownership Percentage | Upgrade |
Jul '20
Nov '20
Mar '21
80.00%
40.00%
10.00%
Analyst Coverage
|
|
Low:--
High:--
|
|
Price Target Std Dev |
|
Price Target Upside (Daily) | Upgrade |
Price Target Num Estimates | Upgrade |
Consensus Rating
|
|
Analyst Recommendation
|
Source: S&P Global
Top Fund Holders
Symbol | Dollars Invested | % Weight |
---|---|---|
F00001ENUI | 377980.0 USD | 3.78% |
F00001DXSS | 350482.0 USD | 3.50% |
F00001EAWE | 336067.0 USD | 3.36% |
FTGSTX | 329238.0 USD | 3.29% |
F00001F0O9 | 320504.0 USD | 3.21% |
EVF161 | 753810.0 USD | 1.29% |
EDGE.TO | 753810.0 USD | 1.29% |
Other Resources
Whale Wisdom | 13F Filings |
Seeking Alpha | Call Transcripts |
Nasdaq | Insider Trading |
Nasdaq | Institutional Ownership |
Nasdaq | Option Chain |
SEC | SEC Filings |
FANUY Tweets |