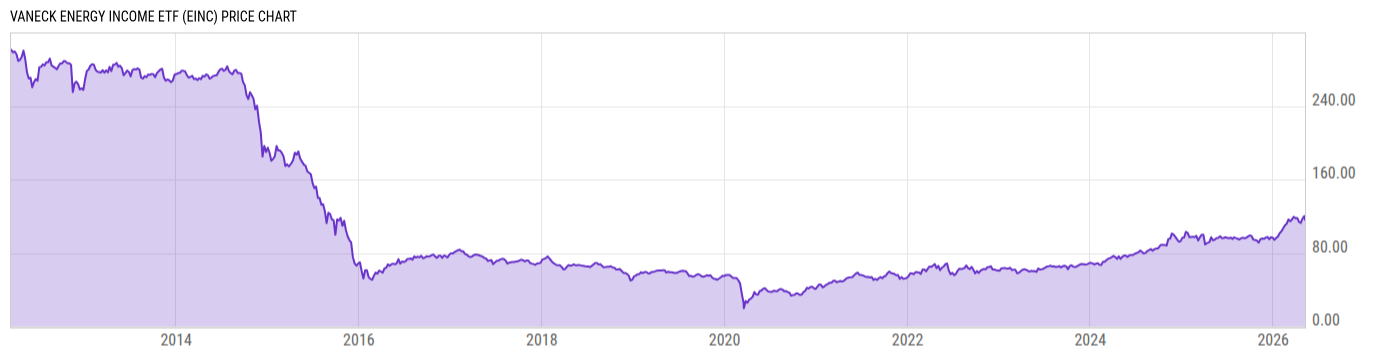
VanEck Energy Income ETF (EINC)
65.80
+0.02 (+0.04%)
USD |
NYSEARCA |
May 27, 16:00
65.80
0.00 (0.00%)
After-Hours: 20:00
Price Chart
Key Stats
Customize
Expense Ratio | Discount or Premium to NAV | Total Assets Under Management | 30-Day Average Daily Volume |
---|---|---|---|
0.46% | -0.00% | 32.21M | 4343.53 |
Dividend Yield | Turnover Ratio | 1 Year Fund Level Flows | Max Drawdown (All) |
4.75% | 24.00% | -1.810M | Upgrade |
Basic Info
Investment Strategy | |
The investment seeks to replicate as closely as possible, before fees and expenses, the price and yield performance of the MVIS® North America Energy Infrastructure Index. The fund will normally invest at least 80% of its total assets in securities that comprise the fund's benchmark index. The index is a rules-based index designed to give investors a means to track the overall performance of North American companies involved in the midstream energy segment, which includes master limited partnerships ("MLPs") and corporations involved in oil and gas storage and transportation. The fund is non-diversified. |
General | |
Security Type | Exchange-Traded Fund |
Equity Style | Mid Cap/Value |
Fixed Income Style | -- |
Broad Asset Class | Sector Equity |
Broad Category | Equity |
Category Name | Energy Limited Partnership |
Category Index | Morningstar MLP Composite TR USD |
Prospectus Objective | Specialty - Natural Resources |
Fund Owner Firm Name | VanEck |
Prospectus Benchmark Index | |
MVIS NA Energy Infrastructure USD | 100.0% |
Broad Asset Class Benchmark Index | |
^MSWNTR | 100.0% |
Manager Tenure | |
Peter Liao | 6.19 yrs |
Guo Hua (Jason) Jin | 4.14 yrs |
Net Fund Flows Versus Category
1 Month
% Rank:
--
--
Category Low
--
Category High
1 Year
% Rank:
55
-1.810M
-365.11M
Category Low
313.76M
Category High
3 Months
% Rank:
--
--
Category Low
--
Category High
3 Years
% Rank:
--
--
Category Low
--
Category High
6 Months
% Rank:
--
--
Category Low
--
Category High
5 Years
% Rank:
--
--
Category Low
--
Category High
YTD
% Rank:
--
--
Category Low
--
Category High
10 Years
% Rank:
--
--
Category Low
--
Category High
As of April 30, 2022
Performance Versus Category
As of May 26, 2022. Returns for periods of 1 year and above are annualized.
Annual Total Returns Versus Peers
As of May 26, 2022.
Asset Allocation
Top 10 Holdings
Name | % Weight | Price | % Change |
---|---|---|---|
Enbridge Inc | 7.78% | 58.78 | 0.32% |
TC Energy Corp | 7.77% | 73.13 | 0.27% |
Kinder Morgan Inc Class P | 7.04% | 19.94 | 1.63% |
Williams Companies Inc | 6.98% | 37.47 | 1.49% |
Cheniere Energy Inc | 5.81% | 138.32 | 1.63% |
Pembina Pipeline Corp | 5.21% | 51.27 | 0.89% |
ONEOK Inc | 5.11% | 67.04 | 1.86% |
Energy Transfer LP | 4.81% | 11.66 | 0.78% |
Keyera Corp | 4.76% | 33.72 | 0.60% |
Enterprise Products Partners LP | 4.65% | 27.60 | 0.80% |
News
Headline
Wire
Time (ET)
Basic Info
Investment Strategy | |
The investment seeks to replicate as closely as possible, before fees and expenses, the price and yield performance of the MVIS® North America Energy Infrastructure Index. The fund will normally invest at least 80% of its total assets in securities that comprise the fund's benchmark index. The index is a rules-based index designed to give investors a means to track the overall performance of North American companies involved in the midstream energy segment, which includes master limited partnerships ("MLPs") and corporations involved in oil and gas storage and transportation. The fund is non-diversified. |
General | |
Security Type | Exchange-Traded Fund |
Equity Style | Mid Cap/Value |
Fixed Income Style | -- |
Broad Asset Class | Sector Equity |
Broad Category | Equity |
Category Name | Energy Limited Partnership |
Category Index | Morningstar MLP Composite TR USD |
Prospectus Objective | Specialty - Natural Resources |
Fund Owner Firm Name | VanEck |
Prospectus Benchmark Index | |
MVIS NA Energy Infrastructure USD | 100.0% |
Broad Asset Class Benchmark Index | |
^MSWNTR | 100.0% |
Manager Tenure | |
Peter Liao | 6.19 yrs |
Guo Hua (Jason) Jin | 4.14 yrs |
Fundamentals
General | |
Distribution Yield | Upgrade |
Dividend Yield TTM (5-27-22) | 4.75% |
30-Day SEC Yield (5-26-22) | Upgrade |
7-Day SEC Yield | -- |
Number of Holdings | Upgrade |
Stock | |
Weighted Average PE Ratio | 17.62 |
Weighted Average Price to Sales Ratio | Upgrade |
Weighted Average Price to Book Ratio | Upgrade |
Weighted Median ROE | Upgrade |
Weighted Median ROA | Upgrade |
Forecasted Dividend Yield | Upgrade |
Forecasted PE Ratio | Upgrade |
Forecasted Price to Sales Ratio | Upgrade |
Forecasted Price to Book Ratio | Upgrade |
As of May 25, 2022
Growth Estimates
Fund Details
Key Dates | |
Inception Date | 3/12/2012 |
Last Annual Report Date | 9/30/2021 |
Last Prospectus Date | 2/1/2022 |
Attributes | |
Enhanced Index Fund | No |
Index Fund |
|
Inverse Fund | No |
Leveraged Fund | No |
Fund of Funds | No |
Currency Hedged Fund | No |
Synthetic Replication Fund | No |
Has Dividend Investment Plan | No |
Socially Responsible Fund | No |
News
Headline
Wire
Time (ET)