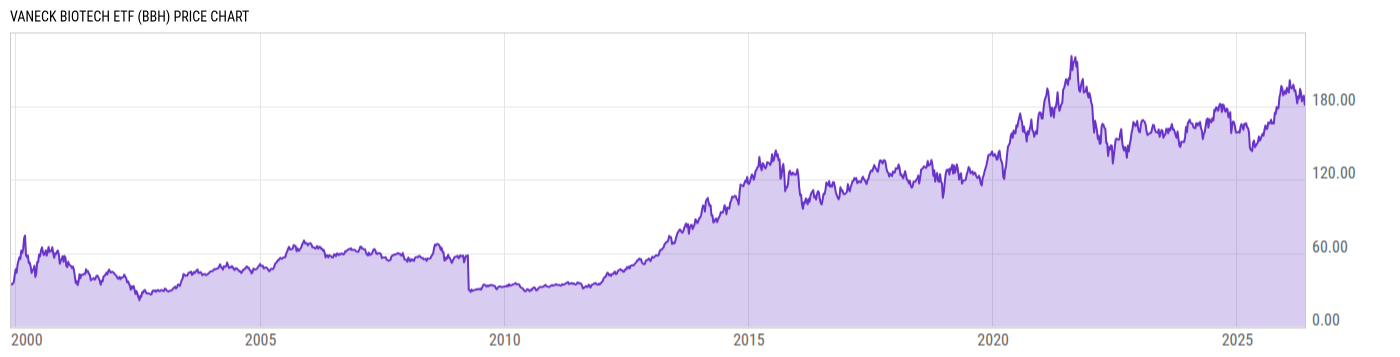
VanEck Vectors Biotech ETF (BBH)
140.26
+0.87 +0.62%
NASDAQ
Dec 10, 16:58
Delayed 2m
USD
Key Stats
Expense Ratio | 0.35% |
Total Assets Under Management | 368.53M |
Share Class Assets Under Management | 368.53M |
30-Day Average Daily Volume | 14852.77 |
Net Asset Value | 139.25 |
Discount or Premium to NAV | 0.10% |
Turnover Ratio | 30.00% |
1 Year Fund Level Flows | -97.24M |
View All BBH News
News
-
WireHeadlineTime (ET)
-
Yahoo12/10 08:33
-
Yahoo12/06 13:00
-
Yahoo12/04 08:32
-
Yahoo12/02 14:40
-
SA Breaking News11/27 13:24
-
Yahoo11/26 19:06
-
Business Wire11/22 17:15
-
Yahoo11/21 12:56
-
Yahoo11/21 09:40
-
Yahoo11/11 14:30
Performance & Returns
Total Return (Price) | Total Return (NAV) | Cat. Total Return (NAV) | % Rank in Cat. (NAV) | |
---|---|---|---|---|
1M | 5.99% | 6.01% | 6.56% | 40 |
3M | 15.30% | 15.20% | 12.68% | 22 |
6M | 15.31% | 15.21% | 11.75% | 17 |
YTD | 25.89% | 25.08% | 22.03% | 25 |
1Y | 18.33% | 18.19% | 14.78% | 30 |
3Y | 9.51% | 9.49% | 14.42% | 84 |
5Y | 3.13% | 3.11% | 7.58% | 91 |
10Y | -- | -- | 14.86% | -- |
15Y | -- | -- | 10.99% | -- |
20Y | -- | -- | 10.34% | -- |
Asset Allocation
Type | % Net | % Long | % Short |
---|---|---|---|
Cash | -0.04% | 0.00% | 0.04% |
Stock | 100.0% | 100.0% | 0.00% |
Bond | 0.00% | 0.00% | 0.00% |
Convertible | 0.00% | 0.00% | 0.00% |
Preferred | 0.00% | 0.00% | 0.00% |
Other | 0.00% | 0.00% | 0.00% |
Region Exposure
Americas | 93.57% |
North America | 93.57% |
Latin America | 0.00% |
Greater Europe | 2.72% |
United Kingdom | 0.00% |
Europe Developed | 2.72% |
Europe Emerging | 0.00% |
Africa/Middle East | 0.00% |
Greater Asia | 3.71% |
Japan | 0.00% |
Australasia | 0.00% |
Asia Developed | 0.00% |
Asia Emerging | 3.71% |
Market Classification | |
% Developed Markets | 96.29% |
% Emerging Markets | 3.71% |
Stock Sector Exposure
Basic Materials | 0.00% |
Communication Services | 0.00% |
Consumer Cyclical | 0.00% |
Consumer Defensive | 0.00% |
Energy | 0.00% |
Financial Services | 0.00% |
Healthcare | 100.0% |
Industrials | 0.00% |
Real Estate | 0.00% |
Technology | 0.00% |
Utilities | 0.00% |
Stock Market Capitalization
Giant | 11.61% |
Large | 50.20% |
Medium | 38.19% |
Small | 0.00% |
Micro | 0.00% |
Stock Style Exposure
Large Cap Value | 19.17% |
Large Cap Blend | 27.58% |
Large Cap Growth | 14.75% |
Mid Cap Value | 0.00% |
Mid Cap Blend | 5.50% |
Mid Cap Growth | 33.00% |
Small Cap Value | 0.00% |
Small Cap Blend | 0.00% |
Small Cap Growth | 0.00% |
View More Holdings
As of Dec. 6, 2019
Top 10 Holdings
Symbol | Name | % Weight | Price | % Chg |
---|---|---|---|---|
AMGN | Amgen Inc | 11.62% | 233.79 | +0.42% |
GILD | Gilead Sciences Inc | 6.95% | 67.07 | +0.21% |
VRTX | Vertex Pharmaceuticals Inc | 5.99% | 220.32 | +0.43% |
BIIB | Biogen Inc | 5.91% | 297.25 | +0.58% |
REGN | Regeneron Pharmaceuticals Inc | 5.49% | 367.24 | +0.44% |
AGN | Allergan PLC | 5.26% | 185.65 | +0.21% |
ILMN | Illumina Inc | 5.23% | 328.00 | +0.43% |
INCY | Incyte Corp | 5.03% | 95.78 | +1.04% |
IQV | IQVIA Holdings Inc | 4.59% | 146.17 | -0.16% |
ALXN | Alexion Pharmaceuticals Inc | 4.37% | 111.13 | -1.20% |
Advertisement
Basic Info
Investment Strategy | |
---|---|
The investment seeks to replicate as closely as possible, before fees and expenses, the price and yield performance of the MVIS® US Listed Biotech 25 Index. The fund normally invests at least 80% of its total assets in securities that comprise the fund's benchmark index. The Biotech Index includes common stocks and depositary receipts of U.S. exchange-listed companies in the biotechnology industry. Such companies may include medium-capitalization companies and foreign companies that are listed on a U.S. exchange. It is non-diversified. | |
General | |
Security Type | Exchange-Traded Fund |
Equity Style | Large Cap/Growth |
Fixed Income Style | -- |
Broad Asset Class | Sector Equity |
Broad Category | Equity |
Category Name | Health |
Prospectus Objective | Specialty - Unaligned |
Fund Owner Firm Name | VanEck |
Benchmark Index | |
MVIS US Listed Biotech 25 NR USD | 100.0% |
Reports | |
One Page Report | Download |
Manager Info
Name | Tenure |
---|---|
Guo Hua (Jason) Jin | 1.83 yrs |
Hao-Hung (Peter) Liao | 7.95 yrs |
Net Fund Flows
1M | 0.00 |
3M | -18.32M |
6M | -37.14M |
YTD | -86.50M |
1Y | -97.24M |
3Y | -321.45M |
5Y | -344.70M |
10Y | -- |
Risk Info
Beta (5Y) | 1.371 |
Max Drawdown (All) | 33.76% |
Historical Sharpe Ratio (10Y) | -- |
Historical Sortino (All) | 1.423 |
30-Day Rolling Volatility | 15.45% |
Daily Value at Risk (VaR) 1% (All) | 3.73% |
Monthly Value at Risk (VaR) 1% (All) | 14.71% |
Fundamentals
Dividend Yield TTM (12-10-19) | 0.39% |
30-Day SEC Yield (10-30-15) | 0.24% |
7-Day SEC Yield | -- |
Weighted Average PE Ratio | 23.63 |
Weighted Average Price to Sales Ratio | 6.224 |
Weighted Average Price to Book Ratio | 4.572 |
Weighted Median ROE | 10.58% |
Weighted Median ROA | 2.62% |
Forecasted Dividend Yield | 0.75% |
Forecasted PE Ratio | 17.59 |
Forecasted Price to Sales Ratio | 5.705 |
Forecasted Price to Book Ratio | 4.061 |
Number of Holdings | 25 |
Growth Estimates
Forecasted 5 Yr Earnings Growth | 9.90% |
Forecasted Book Value Growth | 7.63% |
Forecasted Cash Flow Growth | 6.12% |
Forecasted Earnings Growth | 18.00% |
Forecasted Revenue Growth | 7.79% |
Attributes
Key Dates | |
---|---|
Inception Date | 12/20/2011 |
Termination Date | |
Last Annual Report Date | 9/30/2018 |
Last Prospectus Date | 2/1/2019 |
Attributes | |
Exchange Traded Share | Yes |
Exchange Traded Note | No |
Enhanced Index Fund | No |
Fixed Distribution Fund | No |
High-Net Worth Individual Fund | No |
Index Fund | Yes |
Inverse Fund | No |
Leveraged Fund | No |
Fund of Funds | No |
Currency Hedged Fund | No |
Synthetic Replication Fund | No |
Has Dividend Investment Plan | No |
Socially Responsible Fund | No |
General Availability | |
Available for Insurance Product | No |
Available for Retirement Plan | No |
Available for RRSP | No |
Advertisement