

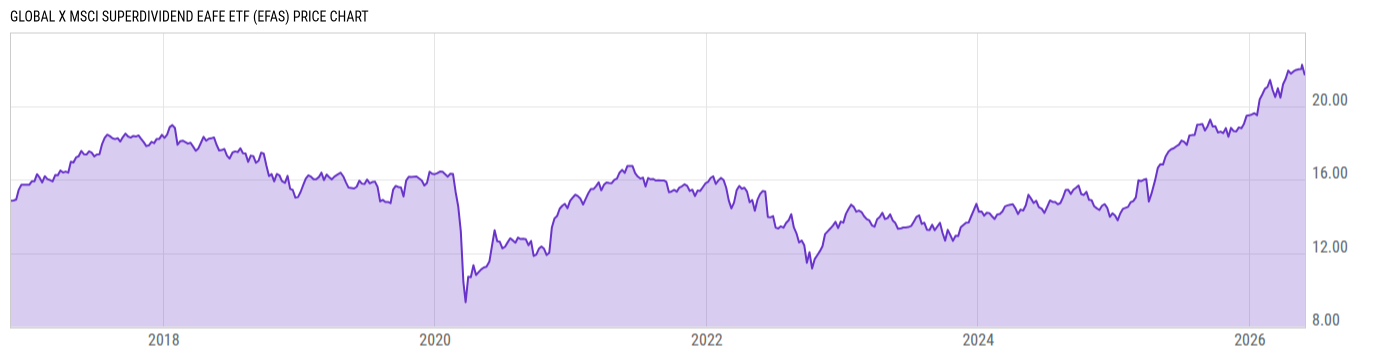
Global X MSCI SuperDividend EAFE ETF (EFAS)
21.76
+0.04
(+0.18%)
USD |
NASDAQ |
May 29, 16:00
21.50
-0.26
(-1.19%)
After-Hours: 20:00
Price Chart
Key Stats
| Net Expense Ratio | Discount or Premium to NAV | Total Assets Under Management | 30-Day Average Daily Volume |
|---|---|---|---|
| 0.55% | -0.18% | 54.28M | 17070.77 |
| Weighted Average Dividend Yield | Turnover Ratio (Generic) | 1 Year Fund Level Flows | Max Drawdown (Since Inception) |
| 5.64% | 35.00% | 30.15M |
Basic Info
| Investment Strategy | |
| The Fund seeks to invests at least 80% of its total assets in the securities of the MSCI EAFE Top 50 Dividend Index (Underlying Index). The Underlying Index tracks the performance of 50 equally-weighted companies that rank among the highest dividend yielding equity securities in Europe, Australasia and the Far East. |
| General | |
| Security Type | Exchange-Traded Fund |
| Equity Style | Multi Cap Value |
| Broad Asset Class | International Equity |
| Broad Category | Equity |
| Global Peer Group | Equity Global ex US |
| Peer Group | International Multi-Cap Value |
| Global Macro | Equity Global |
| US Macro | Developed International Markets Funds |
| YCharts Categorization | -- |
| YCharts Benchmark | -- |
| Prospectus Objective | International Funds |
| Fund Owner Firm Name | Global X |
| Broad Asset Class Benchmark Index | |
| ^MSACXUSNTR | 100.0% |
Performance Versus Peer Group
Annual Total Returns Versus Peers
As of May 30, 2026.
Asset Allocation
As of April 30, 2026.
| Type | % Net |
|---|---|
| Cash | 0.27% |
| Stock | 99.08% |
| Bond | 0.00% |
| Convertible | 0.00% |
| Preferred | 0.00% |
| Other | 0.65% |
Basic Info
| Investment Strategy | |
| The Fund seeks to invests at least 80% of its total assets in the securities of the MSCI EAFE Top 50 Dividend Index (Underlying Index). The Underlying Index tracks the performance of 50 equally-weighted companies that rank among the highest dividend yielding equity securities in Europe, Australasia and the Far East. |
| General | |
| Security Type | Exchange-Traded Fund |
| Equity Style | Multi Cap Value |
| Broad Asset Class | International Equity |
| Broad Category | Equity |
| Global Peer Group | Equity Global ex US |
| Peer Group | International Multi-Cap Value |
| Global Macro | Equity Global |
| US Macro | Developed International Markets Funds |
| YCharts Categorization | -- |
| YCharts Benchmark | -- |
| Prospectus Objective | International Funds |
| Fund Owner Firm Name | Global X |
| Broad Asset Class Benchmark Index | |
| ^MSACXUSNTR | 100.0% |