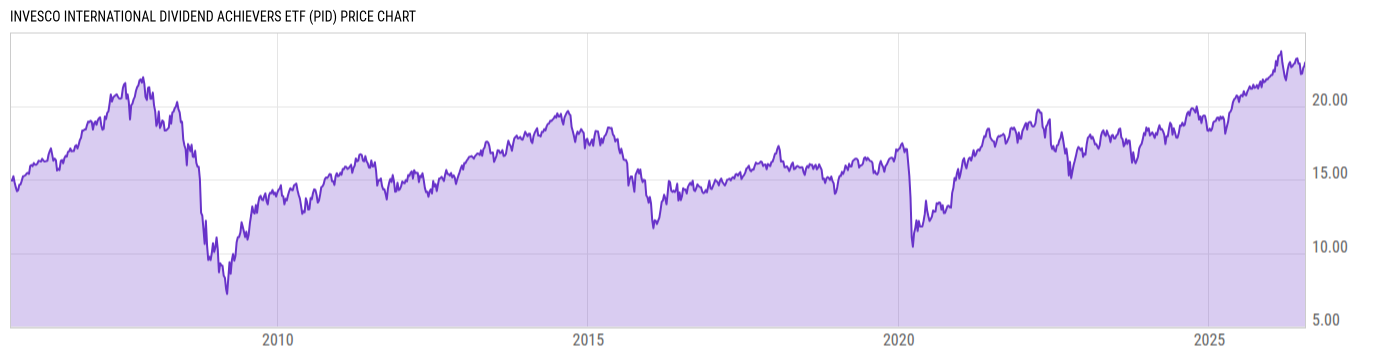
Key Stats

Expense Ratio Discount or Premium to NAV Total Assets Under Management 30-Day Average Daily Volume
0.53% 0.06% 983.78M 252121.6
Dividend Yield Turnover Ratio 1 Year Fund Level Flows Max Drawdown (All)
3.61% 44.00% 353.88M Upgrade

Basic Info

Investment Strategy
The investment seeks to track the investment results (before fees and expenses) of the NASDAQ International Dividend AchieversTM Index. The fund generally will invest at least 90% of its total assets in the securities that comprise the underlying index. The underlying index is composed of Global Depositary Receipts (“GDRs”) that are listed on the London Stock Exchange (“LSE”) or the London International Exchange, American Depositary Receipts (“ADRs”), non-U.S. common or ordinary stocks, limited partnership interests and shares of limited liability companies that are listed on the NYSE.
General
Security Type Exchange-Traded Fund
Equity Style Large Cap/Blend
Fixed Income Style --
Broad Asset Class International Equity
Broad Category Equity
Category Name Foreign Large Value
Category Index MSCI ACWI Ex USA Value NR USD
Global Category Name Global Equity Large Cap
YCharts Categorization Global Equity Large Cap
YCharts Benchmark MSCI ACWI Ex USA Total Return (^MSACXUSTR)
Prospectus Objective Foreign Stock
Fund Owner Firm Name Invesco
Prospectus Benchmark Index
NASDAQ Int'l Dividend Achievers TR USD 100.0%
Broad Asset Class Benchmark Index
^MSACXUSNTR 100.0%
Manager Tenure
Peter Hubbard 15.76 yrs
Michael Jeanette 14.51 yrs
Tony Seisser 8.51 yrs
Pratik Doshi 2.51 yrs

Net Fund Flows Versus Category

View Net Fund Flows. Upgrade now.
1M
3M
6M
YTD
1Y
3Y
5Y
10Y
 
80.00B
60.00B
40.00B
20.00B
0
-20.00B
1 Month
% Rank: --
-- Category Low
-- Category High
1 Year
% Rank: 7
353.88M
-4.846B Category Low
2.126B Category High
3 Months
% Rank: --
-- Category Low
-- Category High
3 Years
% Rank: --
-- Category Low
-- Category High
6 Months
% Rank: --
-- Category Low
-- Category High
5 Years
% Rank: --
-- Category Low
-- Category High
YTD
% Rank: --
-- Category Low
-- Category High
10 Years
% Rank: --
-- Category Low
-- Category High
As of February 28, 2023

Performance Versus Category

 
20%
15%
10%
5%
0
View Category Returns. Upgrade now.
Name
1M
3M
YTD
1Y
3Y
5Y
10Y
15Y
Total Return (Price)
--
--
--
--
--
--
--
--
Total Return (NAV)
--
--
--
--
--
--
--
--
Category Rtn. (NAV)
--
--
--
--
--
--
--
--
% Rank in Cat (NAV)
--
--
--
--
--
--
--
--
As of March 23, 2023. Returns for periods of 1 year and above are annualized.

Annual Total Returns Versus Peers

Loading chart...
Name
2016
2017
2018
2019
2020
2021
2022
YTD
10.40%
19.02%
-11.44%
25.83%
-6.46%
24.49%
-6.50%
2.37%
4.50%
27.19%
-14.20%
21.51%
10.65%
7.82%
-16.00%
4.58%
5.33%
26.25%
-17.55%
21.27%
4.23%
12.88%
-13.73%
3.57%
3.09%
24.07%
-13.50%
18.98%
-2.37%
10.75%
-9.08%
3.42%
14.04%
18.90%
-11.08%
20.25%
-5.06%
10.56%
-13.00%
4.01%
10.86%
24.05%
-20.00%
27.28%
9.55%
12.05%
-15.75%
5.86%
As of March 23, 2023.

Fundamentals

General
Distribution Yield Upgrade
Dividend Yield TTM (3-24-23) 3.61%
30-Day SEC Yield (2-28-23) Upgrade
7-Day SEC Yield --
Number of Holdings Upgrade
Stock
Weighted Average PE Ratio 18.08
Weighted Average Price to Sales Ratio Upgrade
Weighted Average Price to Book Ratio Upgrade
Weighted Median ROE Upgrade
Weighted Median ROA Upgrade
Forecasted Dividend Yield Upgrade
Forecasted PE Ratio Upgrade
Forecasted Price to Sales Ratio Upgrade
Forecasted Price to Book Ratio Upgrade
As of March 22, 2023

Growth Estimates

Forecasted 5 Yr Earnings Growth Upgrade
Forecasted Book Value Growth Upgrade
Forecasted Cash Flow Growth Upgrade
Forecasted Earnings Growth Upgrade
Forecasted Revenue Growth Upgrade
As of March 22, 2023

Asset Allocation

As of March 22, 2023.
Type % Net % Long % Short
Cash 0.58% Upgrade Upgrade
Stock 99.42% Upgrade Upgrade
Bond 0.00% Upgrade Upgrade
Convertible 0.00% Upgrade Upgrade
Preferred 0.00% Upgrade Upgrade
Other 0.00% Upgrade Upgrade

Top 10 Holdings

Name % Weight Price % Change
Algonquin Power & Utilities Corp 4.14% 11.00 3.48%
Brookfield Renewable Partners LP 4.13% 39.96 0.15%
BCE Inc 4.01% 60.79 0.83%
Atlantica Sustainable Infrastructure PLC 3.97% 27.40 1.80%
Enbridge Inc 3.95% 50.43 0.88%
TC Energy Corp 3.86% 52.00 1.36%
TELUS Corp 3.80% 27.30 0.55%
Rio Tinto PLC ADR 3.78% 64.68 0.12%
Canadian Imperial Bank of Commerce 3.70% 56.66 -0.11%
National Grid PLC ADR 3.69% 65.32 1.60%

Basic Info

Investment Strategy
The investment seeks to track the investment results (before fees and expenses) of the NASDAQ International Dividend AchieversTM Index. The fund generally will invest at least 90% of its total assets in the securities that comprise the underlying index. The underlying index is composed of Global Depositary Receipts (“GDRs”) that are listed on the London Stock Exchange (“LSE”) or the London International Exchange, American Depositary Receipts (“ADRs”), non-U.S. common or ordinary stocks, limited partnership interests and shares of limited liability companies that are listed on the NYSE.
General
Security Type Exchange-Traded Fund
Equity Style Large Cap/Blend
Fixed Income Style --
Broad Asset Class International Equity
Broad Category Equity
Category Name Foreign Large Value
Category Index MSCI ACWI Ex USA Value NR USD
Global Category Name Global Equity Large Cap
YCharts Categorization Global Equity Large Cap
YCharts Benchmark MSCI ACWI Ex USA Total Return (^MSACXUSTR)
Prospectus Objective Foreign Stock
Fund Owner Firm Name Invesco
Prospectus Benchmark Index
NASDAQ Int'l Dividend Achievers TR USD 100.0%
Broad Asset Class Benchmark Index
^MSACXUSNTR 100.0%
Manager Tenure
Peter Hubbard 15.76 yrs
Michael Jeanette 14.51 yrs
Tony Seisser 8.51 yrs
Pratik Doshi 2.51 yrs

Fundamentals

General
Distribution Yield Upgrade
Dividend Yield TTM (3-24-23) 3.61%
30-Day SEC Yield (2-28-23) Upgrade
7-Day SEC Yield --
Number of Holdings Upgrade
Stock
Weighted Average PE Ratio 18.08
Weighted Average Price to Sales Ratio Upgrade
Weighted Average Price to Book Ratio Upgrade
Weighted Median ROE Upgrade
Weighted Median ROA Upgrade
Forecasted Dividend Yield Upgrade
Forecasted PE Ratio Upgrade
Forecasted Price to Sales Ratio Upgrade
Forecasted Price to Book Ratio Upgrade
As of March 22, 2023

Growth Estimates

Forecasted 5 Yr Earnings Growth Upgrade
Forecasted Book Value Growth Upgrade
Forecasted Cash Flow Growth Upgrade
Forecasted Earnings Growth Upgrade
Forecasted Revenue Growth Upgrade
As of March 22, 2023

Fund Details

Key Dates
Inception Date 9/15/2005
Last Annual Report Date 4/30/2022
Last Prospectus Date 8/26/2022
Attributes
Index Fund Yes
Inverse Fund No
Leveraged Fund No
Fund of Funds No
Currency Hedged Fund No
Synthetic Replication Fund No
Has Dividend Investment Plan No
Socially Responsible Fund No

Top Portfolio Holders

0 of 0