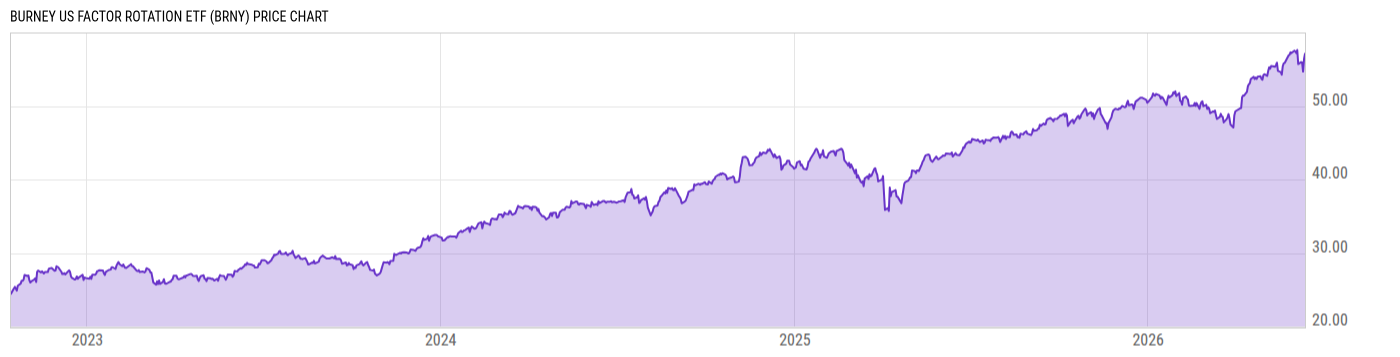
Burney U.S. Factor Rotation ETF (BRNY)
25.85
+0.05
(+0.19%)
USD |
NASDAQ |
Mar 24, 16:00
Key Stats
Expense Ratio | Discount or Premium to NAV | Total Assets Under Management | 30-Day Average Daily Volume |
---|---|---|---|
0.79% | -0.06% | 148.83M | 6022.17 |
Dividend Yield | Turnover Ratio | 1 Year Fund Level Flows | Max Drawdown (All) |
0.23% | -- | -- | Upgrade |
Basic Info
Investment Strategy | |
The investment seeks capital appreciation. The fund is an actively managed exchange-traded fund (“ETF”) that seeks long term growth of capital. The fund seeks to achieve its investment objective by investing, under normal circumstances, at least 80% of the fund’s net assets plus the amount of any borrowings for investment purposes in U.S. listed common stock. The fund will invest its assets in common stocks of large, mid, and small-capitalization companies. |
General | |
Security Type | Exchange-Traded Fund |
Equity Style | Mid Cap/Blend |
Fixed Income Style | -- |
Broad Asset Class | US Equity |
Broad Category | Equity |
Category Name | Large Blend |
Category Index | -- |
Global Category Name | US Equity Large Cap Blend |
YCharts Categorization | US Large Cap Blend |
YCharts Benchmark | S&P 500 Total Return (^SPXTR) |
Prospectus Objective | Growth |
Fund Owner Firm Name | The Burney Company |
Prospectus Benchmark Index | |
N/A | 100.0% |
Broad Asset Class Benchmark Index | |
^SPXTR | 100.0% |
Manager Tenure | |
Andrew Pratt | 0.38 yrs |
Evgeny Gushcha | 0.38 yrs |
Joel Sues | 0.38 yrs |
Richard Shaner | 0.38 yrs |
Joshua Russell | 0.08 yrs |
Net Fund Flows Versus Category
1 Month
% Rank:
--
--
Category Low
--
Category High
1 Year
% Rank:
--
-24.24B
Category Low
51.36B
Category High
3 Months
% Rank:
--
--
Category Low
--
Category High
3 Years
% Rank:
--
--
Category Low
--
Category High
6 Months
% Rank:
--
--
Category Low
--
Category High
5 Years
% Rank:
--
--
Category Low
--
Category High
YTD
% Rank:
--
--
Category Low
--
Category High
10 Years
% Rank:
--
--
Category Low
--
Category High
As of February 28, 2023
Risk
Performance Versus Category
As of March 24, 2023. Returns for periods of 1 year and above are annualized.
Annual Total Returns Versus Peers
As of March 24, 2023.
Asset Allocation
Top 10 Holdings
Name | % Weight | Price | % Change |
---|---|---|---|
Tyson Foods Inc Class A | 4.78% | 57.06 | 1.75% |
Molina Healthcare Inc | 4.77% | 267.72 | 1.53% |
Boyd Gaming Corp | 4.35% | 60.42 | 0.77% |
JPMorgan Chase & Co | 4.33% | 124.91 | -1.52% |
Exelon Corp | 3.75% | 40.24 | 2.65% |
Marriott International Inc Class A | 2.97% | 156.56 | -2.14% |
The Middleby Corp | 2.79% | 136.22 | 0.37% |
Cadence Design Systems Inc | 2.68% | 204.48 | -1.22% |
Arista Networks Inc | 2.57% | 168.94 | -0.27% |
Marathon Petroleum Corp | 2.51% | 124.70 | -1.15% |
News
Headline
Wire
Time (ET)
Basic Info
Investment Strategy | |
The investment seeks capital appreciation. The fund is an actively managed exchange-traded fund (“ETF”) that seeks long term growth of capital. The fund seeks to achieve its investment objective by investing, under normal circumstances, at least 80% of the fund’s net assets plus the amount of any borrowings for investment purposes in U.S. listed common stock. The fund will invest its assets in common stocks of large, mid, and small-capitalization companies. |
General | |
Security Type | Exchange-Traded Fund |
Equity Style | Mid Cap/Blend |
Fixed Income Style | -- |
Broad Asset Class | US Equity |
Broad Category | Equity |
Category Name | Large Blend |
Category Index | -- |
Global Category Name | US Equity Large Cap Blend |
YCharts Categorization | US Large Cap Blend |
YCharts Benchmark | S&P 500 Total Return (^SPXTR) |
Prospectus Objective | Growth |
Fund Owner Firm Name | The Burney Company |
Prospectus Benchmark Index | |
N/A | 100.0% |
Broad Asset Class Benchmark Index | |
^SPXTR | 100.0% |
Manager Tenure | |
Andrew Pratt | 0.38 yrs |
Evgeny Gushcha | 0.38 yrs |
Joel Sues | 0.38 yrs |
Richard Shaner | 0.38 yrs |
Joshua Russell | 0.08 yrs |
Fundamentals
General | |
Distribution Yield | Upgrade |
Dividend Yield TTM (3-24-23) | 0.23% |
30-Day SEC Yield | -- |
7-Day SEC Yield | -- |
Number of Holdings | Upgrade |
Stock | |
Weighted Average PE Ratio | 12.29 |
Weighted Average Price to Sales Ratio | Upgrade |
Weighted Average Price to Book Ratio | Upgrade |
Weighted Median ROE | Upgrade |
Weighted Median ROA | Upgrade |
Forecasted Dividend Yield | Upgrade |
Forecasted PE Ratio | Upgrade |
Forecasted Price to Sales Ratio | Upgrade |
Forecasted Price to Book Ratio | Upgrade |
As of March 23, 2023
Fund Details
Key Dates | |
Inception Date | 10/13/2022 |
Last Annual Report Date | -- |
Last Prospectus Date | 11/18/2022 |
Attributes | |
Index Fund | No |
Inverse Fund | No |
Leveraged Fund | No |
Fund of Funds | No |
Currency Hedged Fund | No |
Synthetic Replication Fund | No |
Has Dividend Investment Plan | No |
Socially Responsible Fund | No |
News
Headline
Wire
Time (ET)