

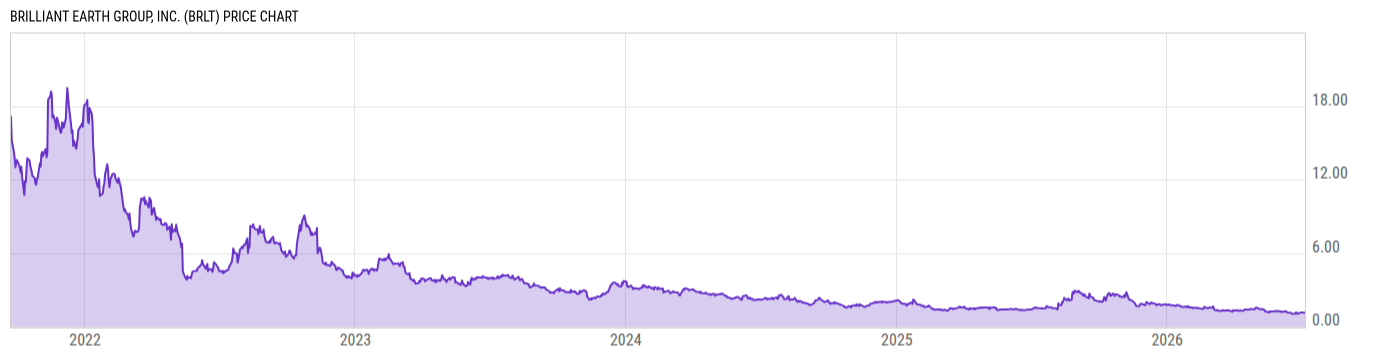
Brilliant Earth Group, Inc. (BRLT)
1.13
-0.01
(-0.88%)
USD |
NASDAQ |
Jul 06, 16:00
1.15
+0.02
(+1.77%)
After-Hours: 20:00
Price Chart
Key Stats
| Price and Performance | |
|---|---|
| Market Cap | 18.26M |
| 52 Week High (Daily) | |
| 52 Week Low (Daily) | |
| All-Time High (Daily) | |
| Year to Date Total Returns (Daily) | |
| 1 Month Total Returns (Daily) | |
| 1 Year Total Returns (Daily) | -11.62% |
| Valuation | |
| PE Ratio | -- |
| PE Ratio (Forward) | |
| PS Ratio | 0.0388 |
| Price to Book Value | 1.601 |
| EV to EBITDA | |
| Dividend | |
|---|---|
| Dividend | 0.25 |
| Dividend Yield (Forward) | |
| Financials | |
| Revenue (5 Year Growth) | |
| Revenue (Quarterly YoY Growth) | |
| EPS Diluted (5 Year Growth) | |
| EPS Diluted (Quarterly YoY Growth) | |
| Debt to Equity Ratio | 3.377 |
| Return on Equity | |
| Return on Assets | |
| Risk | |
| Beta (5Y) | |
| Max Drawdown (5Y) | -- |
Profile
| Brilliant Earth Group, Inc. operates as a holding company, which engages in retail sale of diamonds, gemstones, and jewelry. Its product portfolio consists of diamond engagement and wedding rings, gemstone rings, and fine jewelry. The company was founded by Beth Gerstein and Eric Grossberg in 2005 and is headquartered in San Francisco, CA. |
| URL | http://www.brilliantearth.com |
| Investor Relations URL | N/A |
| HQ State/Province | California |
| Sector | Consumer Discretionary |
| Industry | Specialty Retail |
| Equity Style | Small Cap Core |
| Next Earnings Release | Aug. 06, 2026 (est.) |
| Last Earnings Release | May. 06, 2026 |
| Next Ex-Dividend Date | N/A |
| Last Ex-Dividend Date | Aug. 22, 2025 |