

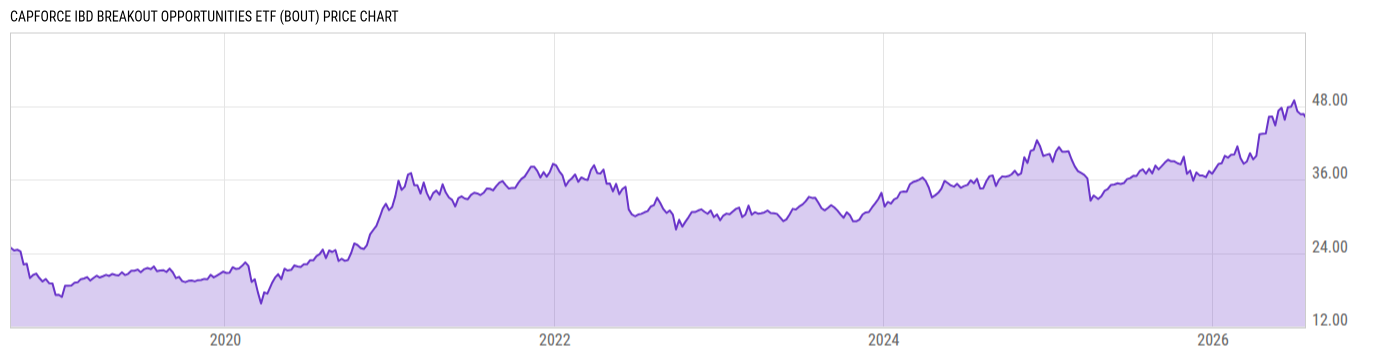
CapForce IBD Breakout Opportunities ETF (BOUT)
46.26
+0.13
(+0.27%)
USD |
NYSEARCA |
Jul 24, 16:00
Price Chart
Key Stats
| Net Expense Ratio | Discount or Premium to NAV | Total Assets Under Management | 30-Day Average Daily Volume |
|---|---|---|---|
| 0.80% | -0.08% | 16.19M | 2622.43 |
| Weighted Average Dividend Yield | Turnover Ratio (Generic) | 1 Year Fund Level Flows | Max Drawdown (Since Inception) |
| 1.37% | 1.67K% | 1.934M |
Basic Info
| Investment Strategy | |
| The Fund seeks to track the performance of the IBD Breakout Stocks Index, which seeks to provide opportunistic investment exposure to stocks with the potential to break out, or experience a period of sustained price growth beyond the stock's recent resistance level, with consideration for various market conditions. |
| General | |
| Security Type | Exchange-Traded Fund |
| Equity Style | Mid Cap Growth |
| Broad Asset Class | US Equity |
| Broad Category | Equity |
| Global Peer Group | Equity US |
| Peer Group | Multi-Cap Growth Funds |
| Global Macro | Equity North America |
| US Macro | Multi-Cap Funds |
| YCharts Categorization | -- |
| YCharts Benchmark | -- |
| Prospectus Objective | Growth Funds |
| Fund Owner Firm Name | Innovator |
| Broad Asset Class Benchmark Index | |
| ^SPXTR | 100.0% |
Performance Versus Peer Group
Annual Total Returns Versus Peers
As of July 25, 2026.
Asset Allocation
As of June 30, 2026.
| Type | % Net |
|---|---|
| Cash | 0.25% |
| Stock | 99.53% |
| Bond | 0.27% |
| Convertible | 0.00% |
| Preferred | 0.00% |
| Other | -0.05% |
Basic Info
| Investment Strategy | |
| The Fund seeks to track the performance of the IBD Breakout Stocks Index, which seeks to provide opportunistic investment exposure to stocks with the potential to break out, or experience a period of sustained price growth beyond the stock's recent resistance level, with consideration for various market conditions. |
| General | |
| Security Type | Exchange-Traded Fund |
| Equity Style | Mid Cap Growth |
| Broad Asset Class | US Equity |
| Broad Category | Equity |
| Global Peer Group | Equity US |
| Peer Group | Multi-Cap Growth Funds |
| Global Macro | Equity North America |
| US Macro | Multi-Cap Funds |
| YCharts Categorization | -- |
| YCharts Benchmark | -- |
| Prospectus Objective | Growth Funds |
| Fund Owner Firm Name | Innovator |
| Broad Asset Class Benchmark Index | |
| ^SPXTR | 100.0% |