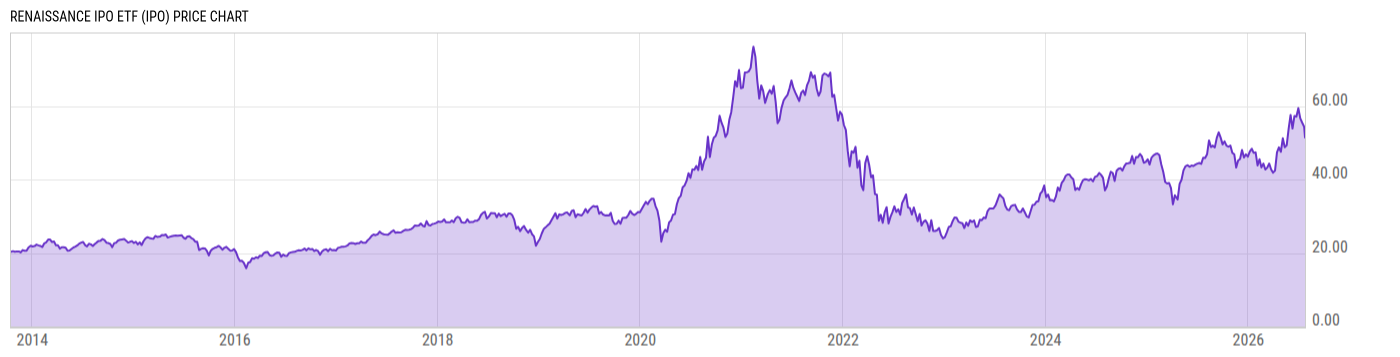
Key Stats

Expense Ratio Discount or Premium to NAV Total Assets Under Management 30-Day Average Daily Volume
0.60% 0.04% 129.00M 67398.60
Dividend Yield Turnover Ratio 1 Year Fund Level Flows Max Drawdown (All)
0.00% 57.00% -32.08M Upgrade

Basic Info

Investment Strategy
The investment seeks to replicate as closely as possible, before fees and expenses, the price and yield performance of the Renaissance IPO Index (the "index"). The fund seeks to replicate as closely as possible, before fees and expenses, the price and yield performance of the index. It normally invests at least 80% of its total assets in securities that comprise the index. The index is a portfolio of companies that have recently completed an initial public offering ("IPO") and are listed on a U.S. exchange. The fund is non-diversified.
General
Security Type Exchange-Traded Fund
Equity Style Mid Cap/Growth
Fixed Income Style --
Broad Asset Class US Equity
Broad Category Equity
Category Name Mid-Cap Growth
Category Index Russell Mid Cap Growth TR USD
Global Category Name US Equity Mid Cap
YCharts Categorization US Mid Cap
YCharts Benchmark Russell Midcap Total Return (^RMCTR)
Prospectus Objective Growth
Fund Owner Firm Name Renaissance Capital
Prospectus Benchmark Index
Renaissance IPO TR USD 100.0%
Broad Asset Class Benchmark Index
^SPXTR 100.0%
Manager Tenure
Tiffany Ng 2.08 yrs

Net Fund Flows Versus Category

View Net Fund Flows. Upgrade now.
1M
3M
6M
YTD
1Y
3Y
5Y
10Y
 
80.00B
60.00B
40.00B
20.00B
0
-20.00B
1 Month
% Rank: --
-- Category Low
-- Category High
1 Year
% Rank: 42
-32.08M
-3.030B Category Low
1.347B Category High
3 Months
% Rank: --
-- Category Low
-- Category High
3 Years
% Rank: --
-- Category Low
-- Category High
6 Months
% Rank: --
-- Category Low
-- Category High
5 Years
% Rank: --
-- Category Low
-- Category High
YTD
% Rank: --
-- Category Low
-- Category High
10 Years
% Rank: --
-- Category Low
-- Category High
As of February 28, 2023

Performance Versus Category

 
20%
15%
10%
5%
0
View Category Returns. Upgrade now.
Name
1M
3M
YTD
1Y
3Y
5Y
10Y
15Y
Total Return (Price)
--
--
--
--
--
--
--
--
Total Return (NAV)
--
--
--
--
--
--
--
--
Category Rtn. (NAV)
--
--
--
--
--
--
--
--
% Rank in Cat (NAV)
--
--
--
--
--
--
--
--
As of March 30, 2023. Returns for periods of 1 year and above are annualized.

Annual Total Returns Versus Peers

Loading chart...
Name
2016
2017
2018
2019
2020
2021
2022
YTD
-0.64%
37.15%
-17.24%
34.11%
107.9%
-10.31%
-57.26%
14.93%
11.96%
21.83%
-4.38%
31.49%
18.40%
28.71%
-18.11%
5.96%
5.93%
25.74%
-6.44%
26.66%
34.90%
21.17%
-24.06%
1.66%
3.72%
20.46%
-13.98%
17.09%
32.86%
13.74%
-21.70%
0.92%
9.50%
25.12%
-7.53%
32.54%
36.97%
13.46%
-23.80%
3.86%
--
19.00%
-6.03%
34.87%
45.63%
12.58%
-28.31%
6.39%
As of March 30, 2023.

Fundamentals

General
Distribution Yield Upgrade
Dividend Yield TTM (3-30-23) 0.00%
30-Day SEC Yield --
7-Day SEC Yield --
Number of Holdings Upgrade
Stock
Weighted Average PE Ratio --
Weighted Average Price to Sales Ratio Upgrade
Weighted Average Price to Book Ratio Upgrade
Weighted Median ROE Upgrade
Weighted Median ROA Upgrade
Forecasted Dividend Yield Upgrade
Forecasted PE Ratio Upgrade
Forecasted Price to Sales Ratio Upgrade
Forecasted Price to Book Ratio Upgrade
As of March 29, 2023

Growth Estimates

Forecasted 5 Yr Earnings Growth Upgrade
Forecasted Book Value Growth Upgrade
Forecasted Cash Flow Growth Upgrade
Forecasted Earnings Growth Upgrade
Forecasted Revenue Growth Upgrade
As of March 29, 2023

Asset Allocation

As of March 29, 2023.
Type % Net % Long % Short
Cash 0.20% Upgrade Upgrade
Stock 99.80% Upgrade Upgrade
Bond 0.00% Upgrade Upgrade
Convertible 0.00% Upgrade Upgrade
Preferred 0.00% Upgrade Upgrade
Other 0.00% Upgrade Upgrade

Basic Info

Investment Strategy
The investment seeks to replicate as closely as possible, before fees and expenses, the price and yield performance of the Renaissance IPO Index (the "index"). The fund seeks to replicate as closely as possible, before fees and expenses, the price and yield performance of the index. It normally invests at least 80% of its total assets in securities that comprise the index. The index is a portfolio of companies that have recently completed an initial public offering ("IPO") and are listed on a U.S. exchange. The fund is non-diversified.
General
Security Type Exchange-Traded Fund
Equity Style Mid Cap/Growth
Fixed Income Style --
Broad Asset Class US Equity
Broad Category Equity
Category Name Mid-Cap Growth
Category Index Russell Mid Cap Growth TR USD
Global Category Name US Equity Mid Cap
YCharts Categorization US Mid Cap
YCharts Benchmark Russell Midcap Total Return (^RMCTR)
Prospectus Objective Growth
Fund Owner Firm Name Renaissance Capital
Prospectus Benchmark Index
Renaissance IPO TR USD 100.0%
Broad Asset Class Benchmark Index
^SPXTR 100.0%
Manager Tenure
Tiffany Ng 2.08 yrs

Fundamentals

General
Distribution Yield Upgrade
Dividend Yield TTM (3-30-23) 0.00%
30-Day SEC Yield --
7-Day SEC Yield --
Number of Holdings Upgrade
Stock
Weighted Average PE Ratio --
Weighted Average Price to Sales Ratio Upgrade
Weighted Average Price to Book Ratio Upgrade
Weighted Median ROE Upgrade
Weighted Median ROA Upgrade
Forecasted Dividend Yield Upgrade
Forecasted PE Ratio Upgrade
Forecasted Price to Sales Ratio Upgrade
Forecasted Price to Book Ratio Upgrade
As of March 29, 2023

Growth Estimates

Forecasted 5 Yr Earnings Growth Upgrade
Forecasted Book Value Growth Upgrade
Forecasted Cash Flow Growth Upgrade
Forecasted Earnings Growth Upgrade
Forecasted Revenue Growth Upgrade
As of March 29, 2023

Fund Details

Key Dates
Inception Date 10/16/2013
Last Annual Report Date 9/30/2022
Last Prospectus Date 1/31/2023
Attributes
Index Fund Yes
Inverse Fund No
Leveraged Fund No
Fund of Funds No
Currency Hedged Fund No
Synthetic Replication Fund No
Has Dividend Investment Plan No
Socially Responsible Fund No

Top Portfolio Holders

0 of 0