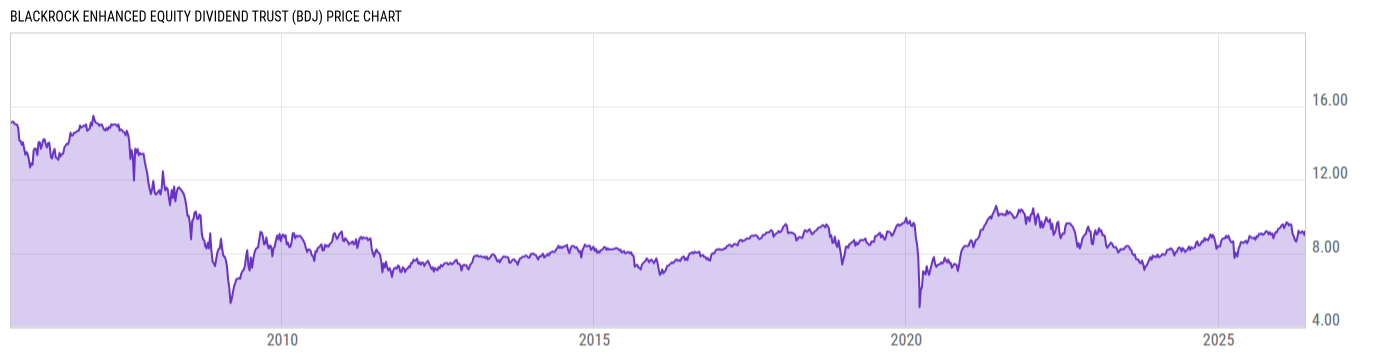
Key Stats

Expense Ratio Discount or Premium to NAV Total Assets Under Management 30-Day Average Daily Volume
0.84% -0.36% 1.573B 377654.8
Dividend Yield Turnover Ratio 1 Year Fund Level Flows Max Drawdown (All)
5.07% 81.00% -48.64M Upgrade

Basic Info

Investment Strategy
The fund invests in equity securities seeking current income and current gains, with a secondary objective of long-term capital appreciation. The Trust will invest in common stocks that pay above average dividends and have the potential for capital appreciation and by utilizing an option writing strategy to enhance distributions. Under normal market conditions, at least 80% of the Funds total assets will be invested in dividend paying equities and up to 20% of its total assets in equity securities of issuers that do not pay dividends.The trust can invest up to 10% of its total assets in private investments.
General
Security Type Closed-End Fund
Equity Style Large Cap/Value
Fixed Income Style --
Broad Asset Class Nontraditional Equity
Broad Category Equity
Category Name Derivative Income
Category Index CBOE S&P 500 BuyWrite BXM PR USD
Global Category Name Equity Miscellaneous
YCharts Categorization Other
YCharts Benchmark S&P 500 Total Return (^SPXTR)
Prospectus Objective Equity-Income
Fund Owner Firm Name BlackRock
Prospectus Benchmark Index
Russell 1000 Value TR USD 100.0%
Broad Asset Class Benchmark Index
^SPXTR 100.0%
Manager Tenure
Kyle McClements 13.04 yrs
Christopher Accettella 10.47 yrs
Tony DeSpirito 8.58 yrs
David Zhao 5.50 yrs

Net Fund Flows Versus Category

View Net Fund Flows. Upgrade now.
1M
3M
6M
YTD
1Y
3Y
5Y
10Y
 
80.00B
60.00B
40.00B
20.00B
0
-20.00B
1 Month
% Rank: --
-- Category Low
-- Category High
1 Year
% Rank: 91
-48.64M
-368.59M Category Low
15.83B Category High
3 Months
% Rank: --
-- Category Low
-- Category High
3 Years
% Rank: --
-- Category Low
-- Category High
6 Months
% Rank: --
-- Category Low
-- Category High
5 Years
% Rank: --
-- Category Low
-- Category High
YTD
% Rank: --
-- Category Low
-- Category High
10 Years
% Rank: --
-- Category Low
-- Category High
As of January 31, 2012

Performance Versus Category

 
20%
15%
10%
5%
0
View Category Returns. Upgrade now.
Name
1M
3M
YTD
1Y
3Y
5Y
10Y
15Y
Total Return (Price)
--
--
--
--
--
--
--
--
Total Return (NAV)
--
--
--
--
--
--
--
--
Category Rtn. (NAV)
--
--
--
--
--
--
--
--
% Rank in Cat (NAV)
--
--
--
--
--
--
--
--
As of March 29, 2023. Returns for periods of 1 year and above are annualized.

Annual Total Returns Versus Peers

Loading chart...
Name
2016
2017
2018
2019
2020
2021
2022
YTD
15.28%
20.77%
-10.41%
38.74%
-7.66%
30.04%
0.76%
-4.90%
11.96%
21.83%
-4.38%
31.49%
18.40%
28.71%
-18.11%
5.35%
3.43%
39.18%
-11.70%
28.77%
16.02%
25.33%
-27.38%
16.78%
6.19%
12.96%
-4.29%
21.24%
13.17%
18.41%
-19.69%
4.65%
1.82%
28.74%
-8.93%
33.67%
7.39%
32.86%
-21.19%
8.50%
11.91%
12.79%
-11.95%
30.89%
12.08%
26.73%
-23.86%
4.15%
As of March 29, 2023.

Fundamentals

General
Distribution Yield Upgrade
Dividend Yield TTM (3-30-23) 5.07%
30-Day SEC Yield --
7-Day SEC Yield --
Number of Holdings Upgrade
Stock
Weighted Average PE Ratio 13.81
Weighted Average Price to Sales Ratio Upgrade
Weighted Average Price to Book Ratio Upgrade
Weighted Median ROE Upgrade
Weighted Median ROA Upgrade
Forecasted Dividend Yield Upgrade
Forecasted PE Ratio Upgrade
Forecasted Price to Sales Ratio Upgrade
Forecasted Price to Book Ratio Upgrade
As of December 31, 2022

Growth Estimates

Forecasted 5 Yr Earnings Growth Upgrade
Forecasted Book Value Growth Upgrade
Forecasted Cash Flow Growth Upgrade
Forecasted Earnings Growth Upgrade
Forecasted Revenue Growth Upgrade
As of December 31, 2022

Asset Allocation

As of December 31, 2022.
Type % Net % Long % Short
Cash 4.66% Upgrade Upgrade
Stock 94.29% Upgrade Upgrade
Bond 0.00% Upgrade Upgrade
Convertible 0.00% Upgrade Upgrade
Preferred 0.00% Upgrade Upgrade
Other 1.04% Upgrade Upgrade

Top 10 Holdings

Name % Weight Price % Change
BlackRock Liquidity T-Fund Instl 4.66% 1.00 0.00%
Wells Fargo & Co 2.81% 37.38 -1.57%
BP PLC
2.74% -- --
Citigroup Inc 2.66% 46.06 0.25%
Medtronic PLC 2.40% 79.19 0.15%
Enterprise Products Partners LP 2.28% 25.75 0.63%
Cognizant Technology Solutions Corp Class A 2.26% 59.80 0.50%
American International Group Inc 2.22% 49.82 2.30%
Laboratory Corp of America Holdings 2.21% 224.64 1.27%
Willis Towers Watson PLC 2.19% 228.92 -0.64%

Basic Info

Investment Strategy
The fund invests in equity securities seeking current income and current gains, with a secondary objective of long-term capital appreciation. The Trust will invest in common stocks that pay above average dividends and have the potential for capital appreciation and by utilizing an option writing strategy to enhance distributions. Under normal market conditions, at least 80% of the Funds total assets will be invested in dividend paying equities and up to 20% of its total assets in equity securities of issuers that do not pay dividends.The trust can invest up to 10% of its total assets in private investments.
General
Security Type Closed-End Fund
Equity Style Large Cap/Value
Fixed Income Style --
Broad Asset Class Nontraditional Equity
Broad Category Equity
Category Name Derivative Income
Category Index CBOE S&P 500 BuyWrite BXM PR USD
Global Category Name Equity Miscellaneous
YCharts Categorization Other
YCharts Benchmark S&P 500 Total Return (^SPXTR)
Prospectus Objective Equity-Income
Fund Owner Firm Name BlackRock
Prospectus Benchmark Index
Russell 1000 Value TR USD 100.0%
Broad Asset Class Benchmark Index
^SPXTR 100.0%
Manager Tenure
Kyle McClements 13.04 yrs
Christopher Accettella 10.47 yrs
Tony DeSpirito 8.58 yrs
David Zhao 5.50 yrs

Fundamentals

General
Distribution Yield Upgrade
Dividend Yield TTM (3-30-23) 5.07%
30-Day SEC Yield --
7-Day SEC Yield --
Number of Holdings Upgrade
Stock
Weighted Average PE Ratio 13.81
Weighted Average Price to Sales Ratio Upgrade
Weighted Average Price to Book Ratio Upgrade
Weighted Median ROE Upgrade
Weighted Median ROA Upgrade
Forecasted Dividend Yield Upgrade
Forecasted PE Ratio Upgrade
Forecasted Price to Sales Ratio Upgrade
Forecasted Price to Book Ratio Upgrade
As of December 31, 2022

Growth Estimates

Forecasted 5 Yr Earnings Growth Upgrade
Forecasted Book Value Growth Upgrade
Forecasted Cash Flow Growth Upgrade
Forecasted Earnings Growth Upgrade
Forecasted Revenue Growth Upgrade
As of December 31, 2022

Fund Details

Key Dates
Inception Date 8/26/2005
Last Annual Report Date 12/31/2022
Last Prospectus Date 8/25/2005
Attributes
Index Fund No
Inverse Fund No
Leveraged Fund No
Fund of Funds No
Currency Hedged Fund No
Synthetic Replication Fund No
Has Dividend Investment Plan Yes
Socially Responsible Fund No

Top Portfolio Holders

0 of 0