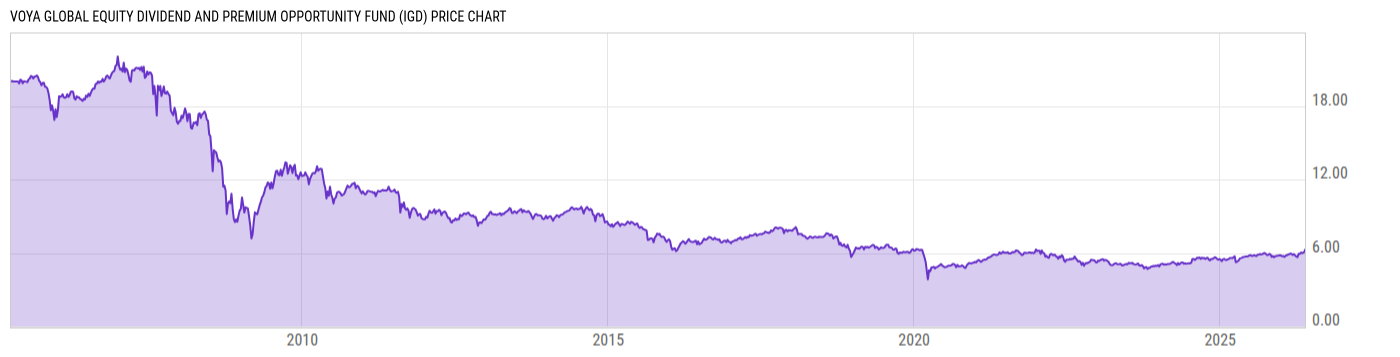
Voya Global Equity Dividend&Premium Opp (IGD)
5.68
+0.03 (+0.53%)
USD |
NYSE |
Aug 12, 16:00
5.685
0.00 (0.00%)
After-Hours: 20:00
Price Chart
Key Stats
Customize
Expense Ratio | Discount or Premium to NAV | Total Assets Under Management | 30-Day Average Daily Volume |
---|---|---|---|
0.99% | -8.97% | 501.34M | 164373.1 |
Dividend Yield | Turnover Ratio | 1 Year Fund Level Flows | Max Drawdown (All) |
1.42% | 64.00% | -104.21M | Upgrade |
Basic Info
Investment Strategy | |
The primary investment objective of the Fund is to seek to provide investors with a high level of income from a portfolio of global common stocks with historically attractive dividend yields and premiums from call option writing. Under normal market conditions, the Fund will invest at least 80% of its managed assets in a portfolio of common stocks of dividend paying companies located throughout the world, including the U.S. The Fund’s secondary investment objective is capital appreciation. |
General | |
Security Type | Closed-End Fund |
Equity Style | Large Cap/Value |
Fixed Income Style | -- |
Broad Asset Class | Nontraditional Equity |
Broad Category | Equity |
Category Name | Derivative Income |
Category Index | CBOE S&P 500 BuyWrite BXM |
Prospectus Objective | World Stock |
Fund Owner Firm Name | Voya Investments, LLC |
Prospectus Benchmark Index | |
MSCI EAFE GR USD | 100.0% |
Broad Asset Class Benchmark Index | |
^SPXTR | 100.0% |
Manager Tenure | |
Paul Zemsky | 3.24 yrs |
Peg DiOrio | 3.24 yrs |
Steven Wetter | 3.24 yrs |
Vincent Costa | 3.24 yrs |
Net Fund Flows Versus Category
1 Month
% Rank:
--
--
Category Low
--
Category High
1 Year
% Rank:
95
-104.21M
-368.59M
Category Low
9.504B
Category High
3 Months
% Rank:
--
--
Category Low
--
Category High
3 Years
% Rank:
--
--
Category Low
--
Category High
6 Months
% Rank:
--
--
Category Low
--
Category High
5 Years
% Rank:
--
--
Category Low
--
Category High
YTD
% Rank:
--
--
Category Low
--
Category High
10 Years
% Rank:
--
--
Category Low
--
Category High
As of January 31, 2012
Performance Versus Category
As of August 12, 2022. Returns for periods of 1 year and above are annualized.
Annual Total Returns Versus Peers
As of August 12, 2022.
Asset Allocation
Top 10 Holdings
Name | % Weight | Price | % Change |
---|---|---|---|
Johnson & Johnson | 2.15% | 165.30 | -1.10% |
Procter & Gamble Co | 1.71% | 146.67 | 0.97% |
Merck & Co Inc | 1.38% | 91.02 | 2.35% |
AbbVie Inc | 1.35% | 142.60 | 0.37% |
iShares Russell 1000 Value ETF | 1.25% | 160.25 | 1.49% |
Verizon Communications Inc | 1.21% | 45.15 | 0.83% |
Pfizer Inc | 1.20% | 50.11 | 3.77% |
PepsiCo Inc | 1.17% | 177.33 | 1.31% |
Chevron Corp | 1.15% | 159.85 | 0.14% |
Bristol-Myers Squibb Co | 1.14% | 75.57 | 1.49% |
News
Headline
Wire
Time (ET)
SA Breaking News
07/15 16:19
SA Breaking News
06/30 13:06
SA Breaking News
04/18 16:42
SA Breaking News
03/31 12:32
SA Breaking News
02/15 16:46
SA Breaking News
01/18 16:48
SA Breaking News
12/17 09:56
SA Breaking News
11/15 18:05
Basic Info
Investment Strategy | |
The primary investment objective of the Fund is to seek to provide investors with a high level of income from a portfolio of global common stocks with historically attractive dividend yields and premiums from call option writing. Under normal market conditions, the Fund will invest at least 80% of its managed assets in a portfolio of common stocks of dividend paying companies located throughout the world, including the U.S. The Fund’s secondary investment objective is capital appreciation. |
General | |
Security Type | Closed-End Fund |
Equity Style | Large Cap/Value |
Fixed Income Style | -- |
Broad Asset Class | Nontraditional Equity |
Broad Category | Equity |
Category Name | Derivative Income |
Category Index | CBOE S&P 500 BuyWrite BXM |
Prospectus Objective | World Stock |
Fund Owner Firm Name | Voya Investments, LLC |
Prospectus Benchmark Index | |
MSCI EAFE GR USD | 100.0% |
Broad Asset Class Benchmark Index | |
^SPXTR | 100.0% |
Manager Tenure | |
Paul Zemsky | 3.24 yrs |
Peg DiOrio | 3.24 yrs |
Steven Wetter | 3.24 yrs |
Vincent Costa | 3.24 yrs |
Fundamentals
General | |
Distribution Yield | Upgrade |
Dividend Yield TTM (8-12-22) | 1.42% |
30-Day SEC Yield (1-31-19) | Upgrade |
7-Day SEC Yield | -- |
Number of Holdings | Upgrade |
Stock | |
Weighted Average PE Ratio | 15.87 |
Weighted Average Price to Sales Ratio | Upgrade |
Weighted Average Price to Book Ratio | Upgrade |
Weighted Median ROE | Upgrade |
Weighted Median ROA | Upgrade |
Forecasted Dividend Yield | Upgrade |
Forecasted PE Ratio | Upgrade |
Forecasted Price to Sales Ratio | Upgrade |
Forecasted Price to Book Ratio | Upgrade |
As of May 31, 2022
Growth Estimates
Fund Details
Key Dates | |
Inception Date | 3/28/2005 |
Last Annual Report Date | 2/28/2022 |
Last Prospectus Date | 3/28/2005 |
Attributes | |
Enhanced Index Fund | No |
Index Fund | No |
Inverse Fund | No |
Leveraged Fund | No |
Fund of Funds | No |
Currency Hedged Fund | No |
Synthetic Replication Fund | No |
Has Dividend Investment Plan |
|
Socially Responsible Fund | No |
News
Headline
Wire
Time (ET)
SA Breaking News
07/15 16:19
SA Breaking News
06/30 13:06
SA Breaking News
04/18 16:42
SA Breaking News
03/31 12:32
SA Breaking News
02/15 16:46
SA Breaking News
01/18 16:48
SA Breaking News
12/17 09:56
SA Breaking News
11/15 18:05