

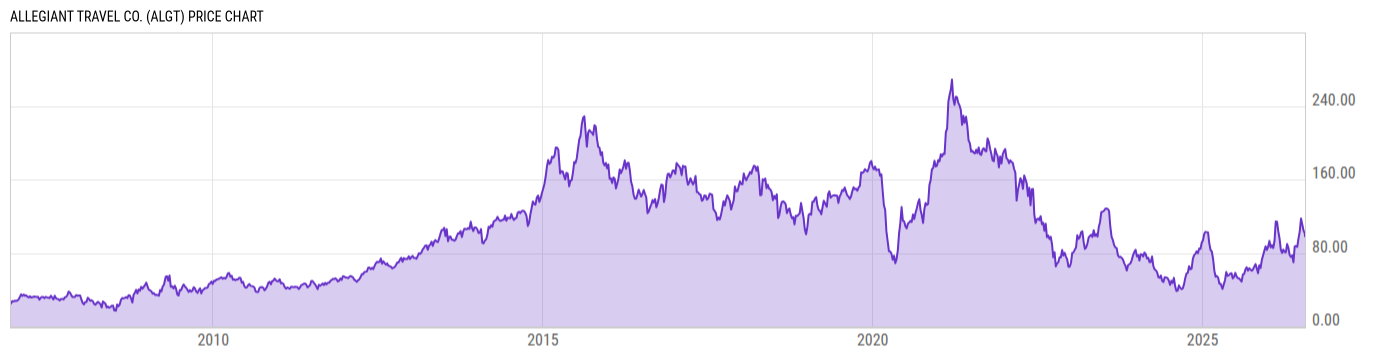
Allegiant Travel Co. (ALGT)
98.26
-3.09
(-3.05%)
USD |
NASDAQ |
Jul 22, 16:00
98.26
0.00 (0.00%)
After-Hours: 18:06
Price Chart
Key Stats
| Price and Performance | |
|---|---|
| Market Cap | 1.813B |
| 52 Week High (Daily) | |
| 52 Week Low (Daily) | |
| All-Time High (Daily) | |
| Year to Date Total Returns (Daily) | |
| 1 Month Total Returns (Daily) | |
| 1 Year Total Returns (Daily) | 96.99% |
| Valuation | |
| PE Ratio | -- |
| PE Ratio (Forward) | |
| PS Ratio | 0.6742 |
| Price to Book Value | 1.654 |
| EV to EBITDA | |
| Dividend | |
|---|---|
| Dividend | -- |
| Dividend Yield (Forward) | |
| Financials | |
| Revenue (5 Year Growth) | |
| Revenue (Quarterly YoY Growth) | |
| EPS Diluted (5 Year Growth) | |
| EPS Diluted (Quarterly YoY Growth) | |
| Debt to Equity Ratio | 1.691 |
| Return on Equity | |
| Return on Assets | |
| Risk | |
| Beta (5Y) | |
| Max Drawdown (5Y) | 86.02% |
Profile
| Allegiant Travel Co. engages in the provision of leisure travel services. It operates through the Airline and Sunseeker Resort segments. The Airline segment involves the scheduled service air transportation, ancillary air-related and third-party products and services, fixed fee contract air transportation, and other airline-related revenue. The Sunseeker Resort segment includes hotel rooms and suites for occupancy, group meeting facilities, food and beverage options, the Aileron Golf Course, and other resort amenities. The company was founded in 1997 and is headquartered in Las Vegas, NV. |
| URL | http://www.allegiantair.com |
| Investor Relations URL | https://ir.allegiantair.com/overview/default.aspx |
| HQ State/Province | Nevada |
| Sector | Industrials |
| Industry | Passenger Airlines |
| Equity Style | Small Cap Value |
| Next Earnings Release | Aug. 04, 2026 |
| Last Earnings Release | Apr. 30, 2026 |
| Next Ex-Dividend Date | N/A |
| Last Ex-Dividend Date | May. 14, 2024 |