

Alset, Inc. (AEI)
1.245
-0.04
(-3.49%)
USD |
NASDAQ |
Jul 10, 16:00
1.245
0.00 (0.00%)
After-Hours: 18:49
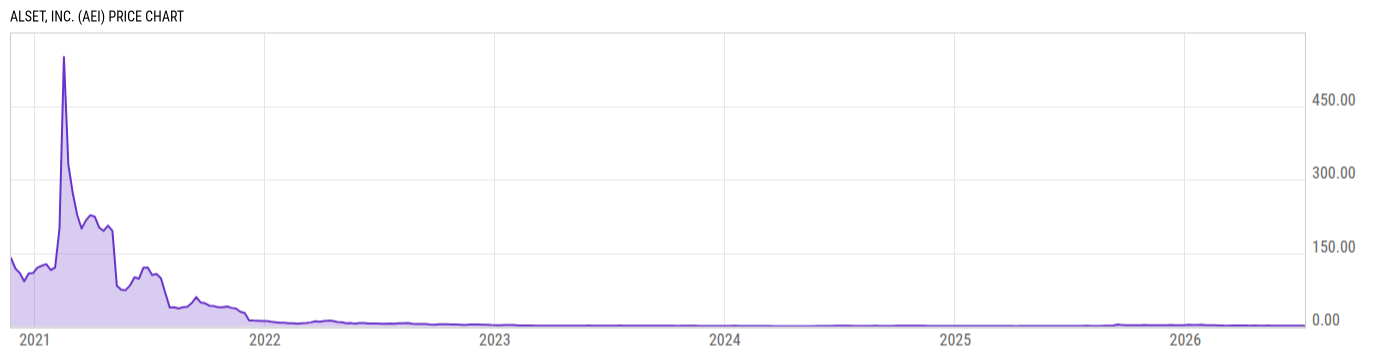
Price Chart
Key Stats
| Price and Performance | |
|---|---|
| Market Cap | 48.43M |
| 52 Week High (Daily) | |
| 52 Week Low (Daily) | |
| All-Time High (Daily) | |
| Year to Date Total Returns (Daily) | |
| 1 Month Total Returns (Daily) | |
| 1 Year Total Returns (Daily) | 18.35% |
| Valuation | |
| PE Ratio | -- |
| PE Ratio (Forward) | |
| PS Ratio | 8.660 |
| Price to Book Value | 0.4056 |
| EV to EBITDA | |
| Dividend | |
|---|---|
| Dividend | -- |
| Dividend Yield (Forward) | |
| Financials | |
| Revenue (5 Year Growth) | |
| Revenue (Quarterly YoY Growth) | |
| EPS Diluted (5 Year Growth) | |
| EPS Diluted (Quarterly YoY Growth) | |
| Debt to Equity Ratio | 0.0142 |
| Return on Equity | |
| Return on Assets | |
| Risk | |
| Beta (5Y) | |
| Max Drawdown (5Y) | 99.92% |
Profile
| Alset, Inc. engages through its subsidiaries in the development of ehome communities and other property development, financial services, digital transformation technologies, biohealth activities and consumer products. It operates through the following business segments: Real Estate, Digital Transformation Technology, Biohealth, and Other Business. The Real Estate segment is engaged in the development of real estate projects near Houston, Texas. The Digital Transformation Technology segment focuses on serving business-to-business (B2B) needs in e-commerce, collaboration and social networking functions. The Biohealth segment includes the sale of consumer products. The Other Business segment consists of several smaller business activities that complement the company’s three principal business areas. The company was founded by Chan Heng Fai on March 7, 2018 and is headquartered in Bethesda, MD. |
| URL | http://www.alsetinc.com |
| Investor Relations URL | https://www.alsetinc.com/stock-information |
| HQ State/Province | Maryland |
| Sector | Real Estate |
| Industry | Real Estate Management & Development |
| Equity Style | Small Cap Value |
| Next Earnings Release | N/A |
| Last Earnings Release | N/A |
| Next Ex-Dividend Date | N/A |
| Last Ex-Dividend Date | N/A |