

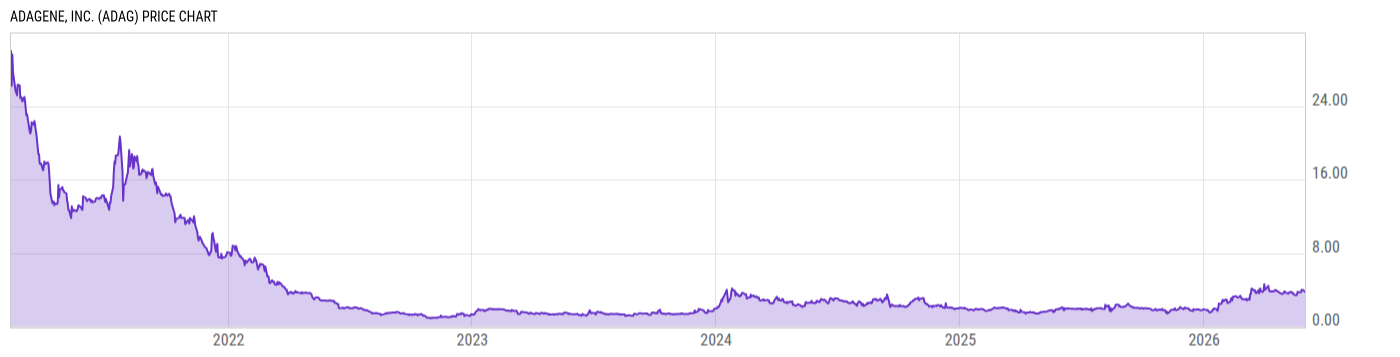
Adagene, Inc. (ADAG)
3.78
-0.19
(-4.79%)
USD |
NASDAQ |
Jun 01, 16:00
Price Chart
Key Stats
| Price and Performance | |
|---|---|
| Market Cap | 178.16M |
| 52 Week High (Daily) | |
| 52 Week Low (Daily) | |
| All-Time High (Daily) | |
| Year to Date Total Returns (Daily) | |
| 1 Month Total Returns (Daily) | |
| 1 Year Total Returns (Daily) | 94.85% |
| Valuation | |
| PE Ratio | -- |
| PE Ratio (Forward) | |
| PS Ratio | 23.22 |
| Price to Book Value | -- |
| EV to EBITDA | |
| Dividend | |
|---|---|
| Dividend | -- |
| Dividend Yield (Forward) | |
| Financials | |
| Revenue (5 Year Growth) | |
| Revenue (Quarterly YoY Growth) | |
| EPS Diluted (5 Year Growth) | |
| EPS Diluted (Quarterly YoY Growth) | |
| Debt to Equity Ratio | -- |
| Return on Equity | |
| Return on Assets | |
| Risk | |
| Beta (5Y) | |
| Max Drawdown (5Y) | 97.00% |
Profile
| Adagene, Inc. is a clinical-stage biopharmaceutical company, which engages in the discovery and development of novel antibody-based cancer immunotherapies. Its dynamic precision library platform is composed of the following proprietary technologies: NEObody, SAFEbody, and POWERbody. The company was founded by Ge Li and Pei Zhi Luo on February 25, 2011 and is headquartered in Suzhou, China. |
| URL | http://www.adagene.com |
| Investor Relations URL | N/A |
| HQ State/Province | Jiangsu |
| Sector | Health Care |
| Industry | Biotechnology |
| Next Earnings Release | N/A |
| Last Earnings Release | Mar. 30, 2023 |
| Next Ex-Dividend Date | N/A |
| Last Ex-Dividend Date | N/A |