

iPath® B S&P 500® VIX S/T Futs™ ETN (VXX)
13.43
-0.45
(-3.24%)
USD |
BATS |
Apr 26, 16:00
13.44
+0.01
(+0.07%)
Pre-Market: 20:00
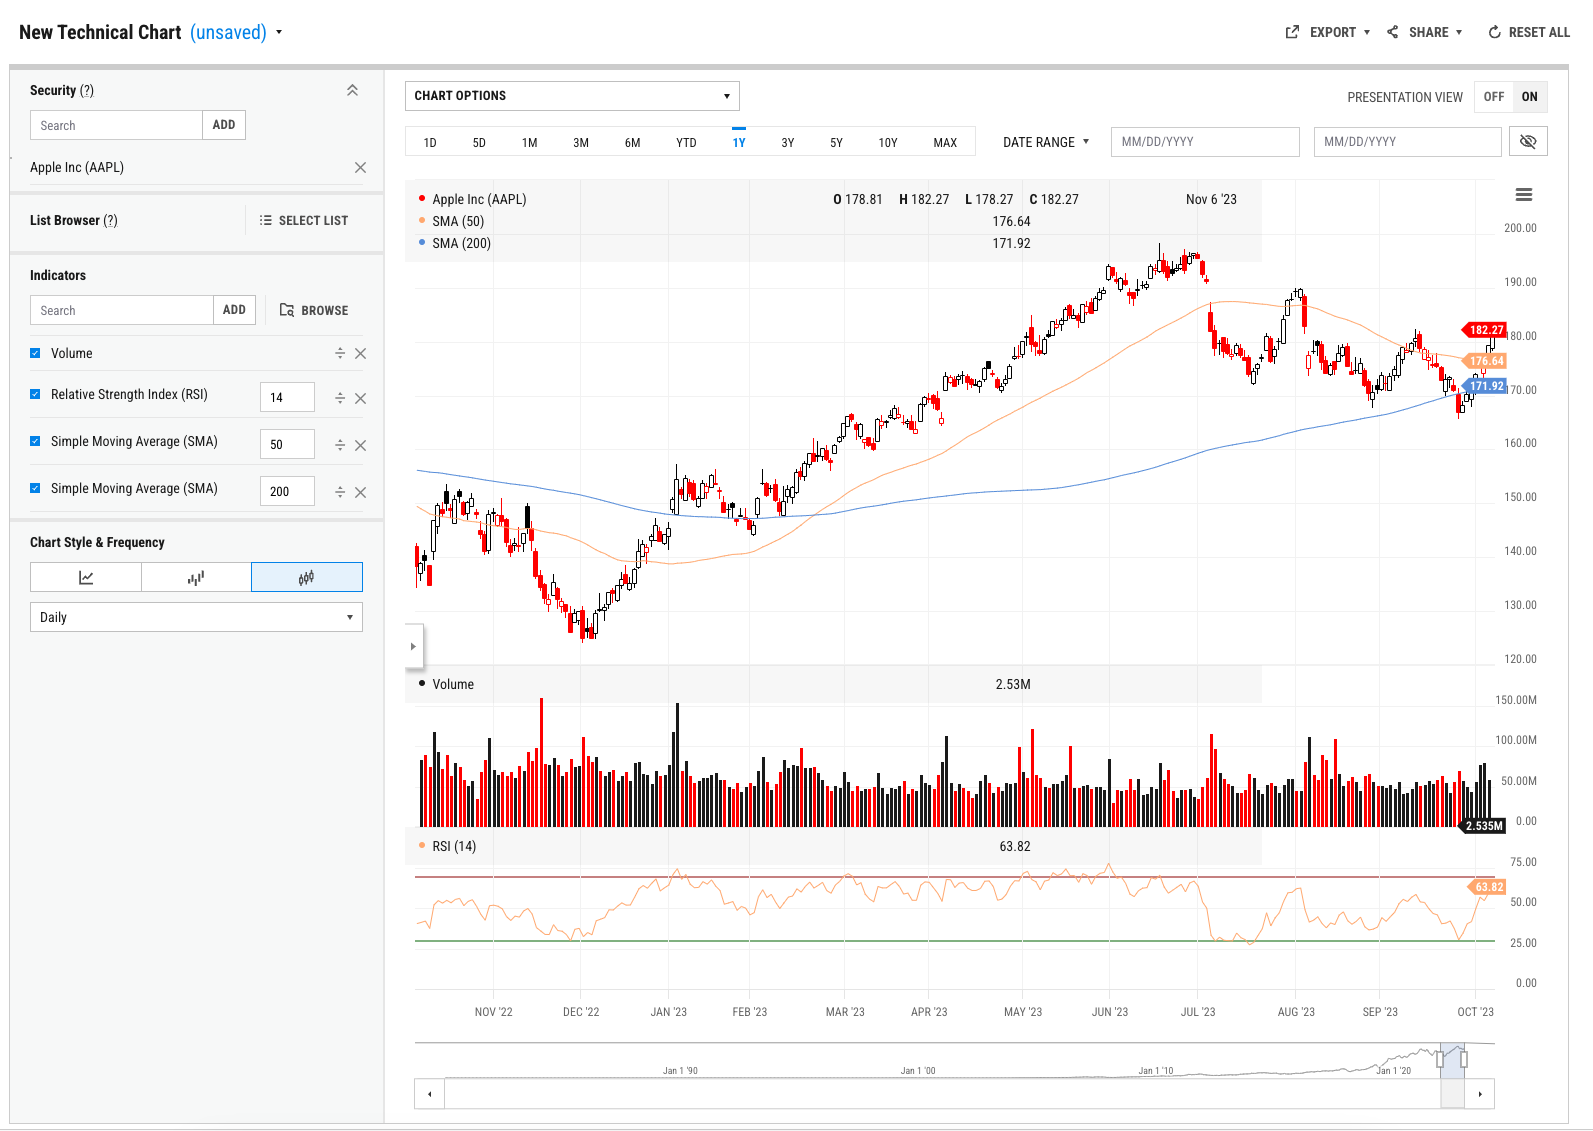
Technical Chart
The Technical Chart tool enables you to create a chart within YCharts that can calculate various technical indicators. Once you choose a security or list, you can pick a combination of technical indicators to chart.
QUESTIONS?
- Email: support@ycharts.com
- Call: (866) 965-7552
READY TO GET STARTED?
Unlock My AccessAccess Technical Chart Now
Unlock access to Technical Chart by registering below. No credit card required.
Unlock My AccessQUESTIONS?
- Email: support@ycharts.com
- Call: (866) 965-7552