

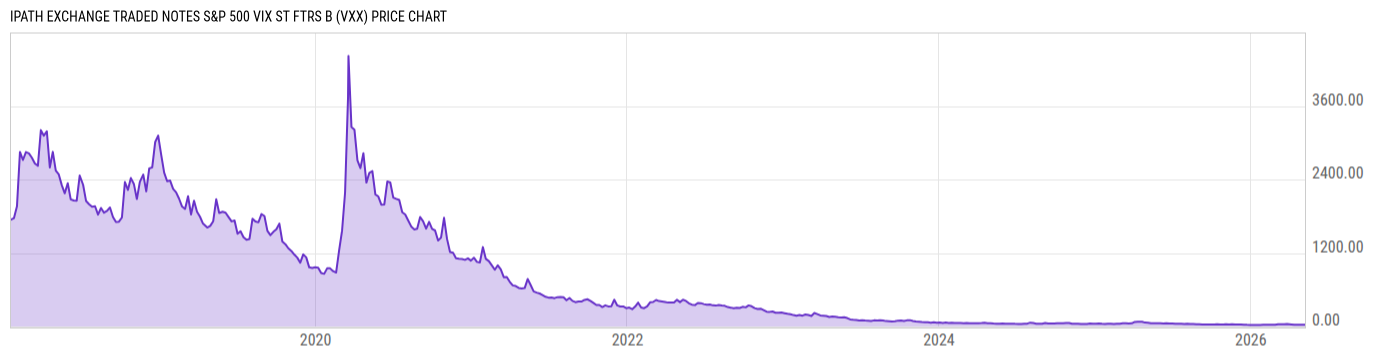
iPath Exchange Traded Notes S&P 500 VIX ST Ftrs B (VXX)
24.47
-0.31
(-1.25%)
USD |
BATS |
Jun 02, 13:23
Price Chart
Key Stats
| Net Expense Ratio | Discount or Premium to NAV | Total Assets Under Management | 30-Day Average Daily Volume |
|---|---|---|---|
| 0.89% | 0.32% | 510.38M | 8.243M |
| Weighted Average Dividend Yield | Turnover Ratio (Generic) | 1 Year Fund Level Flows | Max Drawdown (Since Inception) |
| -- | -- | 462.79M |
Basic Info
| Investment Strategy | |
| The Fund seeks to offer exposure to a daily rolling long position in the first and second month VIX futures contracts and reflects the implied volatility of the S&P 500 Index at various points along the volatility forward curve. Its return is linked to the performance of the S&P 500 VIX Short-Term Futures Index TR. |
| General | |
| Security Type | Exchange-Traded Fund |
| Equity Style | -- |
| Broad Asset Class | Sector Equity |
| Broad Category | Equity |
| Global Peer Group | Equity Other |
| Peer Group | Specialty/Miscellaneous Funds |
| Global Macro | Equity Other |
| US Macro | Sector Equity Funds |
| YCharts Categorization | -- |
| YCharts Benchmark | -- |
| Prospectus Objective | Specialty/Miscellaneous Funds |
| Fund Owner Firm Name | Barclays |
| Broad Asset Class Benchmark Index | |
| ^MSWNTR | 100.0% |
Performance Versus Peer Group
Annual Total Returns Versus Peers
As of June 02, 2026.
Asset Allocation
| Type | % Net |
|---|
Basic Info
| Investment Strategy | |
| The Fund seeks to offer exposure to a daily rolling long position in the first and second month VIX futures contracts and reflects the implied volatility of the S&P 500 Index at various points along the volatility forward curve. Its return is linked to the performance of the S&P 500 VIX Short-Term Futures Index TR. |
| General | |
| Security Type | Exchange-Traded Fund |
| Equity Style | -- |
| Broad Asset Class | Sector Equity |
| Broad Category | Equity |
| Global Peer Group | Equity Other |
| Peer Group | Specialty/Miscellaneous Funds |
| Global Macro | Equity Other |
| US Macro | Sector Equity Funds |
| YCharts Categorization | -- |
| YCharts Benchmark | -- |
| Prospectus Objective | Specialty/Miscellaneous Funds |
| Fund Owner Firm Name | Barclays |
| Broad Asset Class Benchmark Index | |
| ^MSWNTR | 100.0% |