

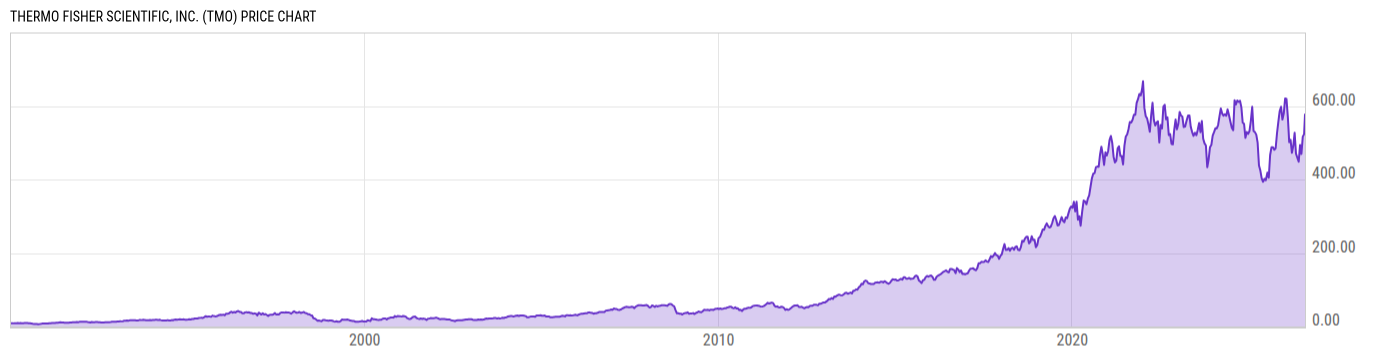
Thermo Fisher Scientific, Inc. (TMO)
576.77
+0.31
(+0.05%)
USD |
NYSE |
Jul 30, 16:00
576.00
-0.77
(-0.13%)
Pre-Market: 20:00
Price Chart
Key Stats
| Price and Performance | |
|---|---|
| Market Cap | 214.34B |
| 52 Week High (Daily) | |
| 52 Week Low (Daily) | |
| All-Time High (Daily) | |
| Year to Date Total Returns (Daily) | |
| 1 Month Total Returns (Daily) | |
| 1 Year Total Returns (Daily) | 21.29% |
| Valuation | |
| PE Ratio | 31.03 |
| PE Ratio (Forward) | |
| PS Ratio | 4.665 |
| Price to Book Value | 4.127 |
| EV to EBITDA | |
| Dividend | |
|---|---|
| Dividend | 0.47 |
| Dividend Yield (Forward) | |
| Financials | |
| Revenue (5 Year Growth) | |
| Revenue (Quarterly YoY Growth) | |
| EPS Diluted (5 Year Growth) | |
| EPS Diluted (Quarterly YoY Growth) | |
| Debt to Equity Ratio | 0.8076 |
| Return on Equity | |
| Return on Assets | |
| Risk | |
| Beta (5Y) | |
| Max Drawdown (5Y) | 40.95% |
Profile
| Thermo Fisher Scientific Inc. offers products and services to customers working in pharmaceutical and biotech companies, hospitals and clinical diagnostic labs, universities, research institutions and government agencies. It operates through the following segments: Life Sciences Solutions, Analytical Instruments, Specialty Diagnostics, and Laboratory Products and Biopharma Services. The Life Sciences Solutions segment provides reagents, instruments and consumables used in biological and medical research, discovery and production of new drugs and vaccines, and diagnosis of disease. The Analytical Instruments segment offers instruments and supporting consumables, software and services. The Specialty Diagnostics segment provides diagnostic test kits, reagents, culture media, instruments and associated products to healthcare, clinical, pharmaceutical, industrial, and food safety laboratories. The Laboratory Products and Biopharma Services segment offers outsourced services used by the pharmaceutical and biotech industries for drug development, clinical research, clinical trials services and commercial drug manufacturing. The company was founded in July 1956 and is headquartered in Waltham, MA. |
| URL | http://corporate.thermofisher.com |
| Investor Relations URL | https://ir.thermofisher.com |
| HQ State/Province | Massachusetts |
| Sector | Health Care |
| Industry | Life Sciences Tools & Services |
| Equity Style | Large Cap Core |
| Next Earnings Release | Oct. 21, 2026 (est.) |
| Last Earnings Release | Jul. 23, 2026 |
| Next Ex-Dividend Date | Sep. 15, 2026 |
| Last Ex-Dividend Date | Jun. 15, 2026 |