

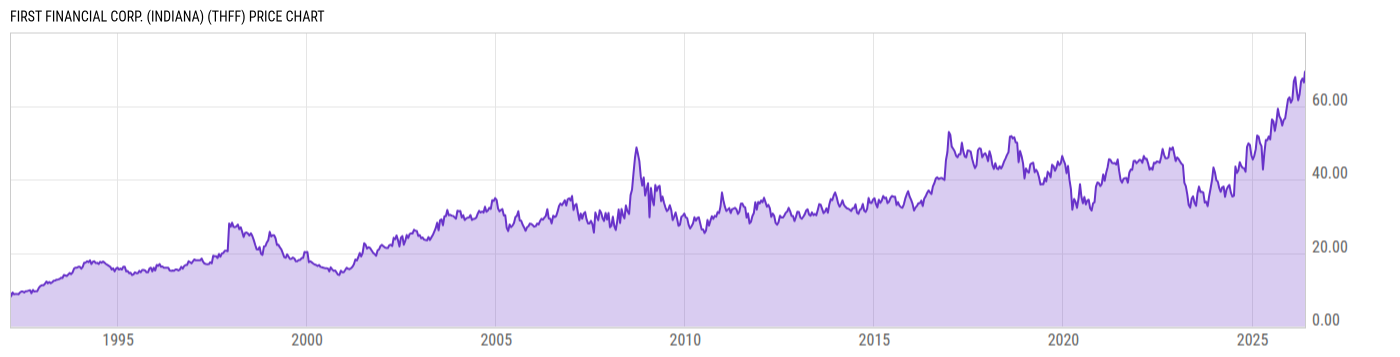
First Financial Corp. (Indiana) (THFF)
71.08
+0.43
(+0.61%)
USD |
NASDAQ |
Jun 05, 16:00
71.12
+0.04
(+0.06%)
After-Hours: 20:00
Price Chart
Key Stats
| Price and Performance | |
|---|---|
| Market Cap | 845.28M |
| 52 Week High (Daily) | |
| 52 Week Low (Daily) | |
| All-Time High (Daily) | |
| Year to Date Total Returns (Daily) | |
| 1 Month Total Returns (Daily) | |
| 1 Year Total Returns (Daily) | 45.85% |
| Valuation | |
| PE Ratio | 10.46 |
| PE Ratio (Forward) | |
| PS Ratio | 2.388 |
| Price to Book Value | 1.290 |
| EV to EBITDA | |
| Dividend | |
|---|---|
| Dividend | 0.56 |
| Dividend Yield (Forward) | |
| Financials | |
| Revenue (5 Year Growth) | |
| Revenue (Quarterly YoY Growth) | |
| EPS Diluted (5 Year Growth) | |
| EPS Diluted (Quarterly YoY Growth) | |
| Debt to Equity Ratio | 0.8636 |
| Return on Equity | |
| Return on Assets | |
| Risk | |
| Beta (5Y) | |
| Max Drawdown (5Y) | 34.92% |
Profile
| First Financial Corp. is a holding company, which engages in providing financial services. It offers commercial, mortgage and consumer lending, lease financing, trust account services, depositor services, and insurance services. The company was founded on October 28, 1982 and is headquartered in Terre Haute, IN. |
| URL | http://www.first-online.bank |
| Investor Relations URL | https://investorrelations.ffin.com |
| HQ State/Province | Indiana |
| Sector | Financials |
| Industry | Banks |
| Next Earnings Release | Jul. 28, 2026 (est.) |
| Last Earnings Release | Apr. 28, 2026 |
| Next Ex-Dividend Date | N/A |
| Last Ex-Dividend Date | Apr. 01, 2026 |