

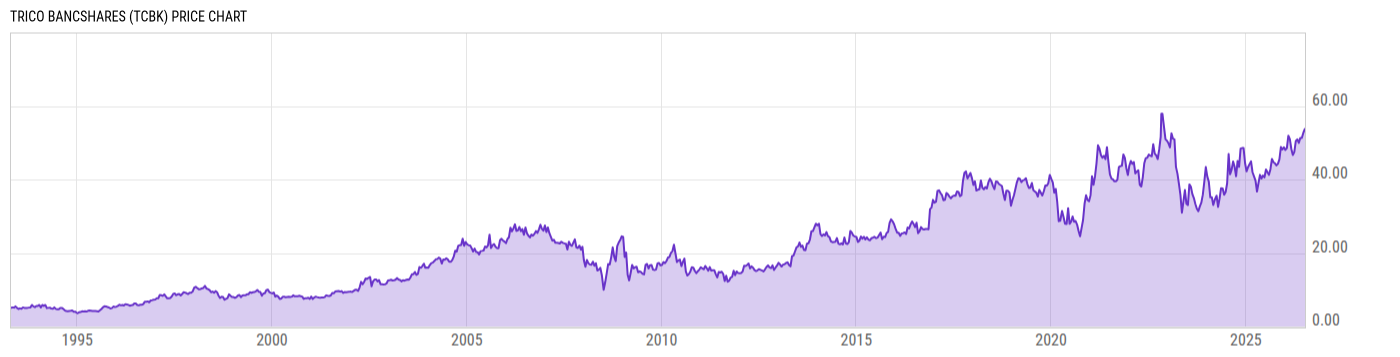
TriCo Bancshares (TCBK)
53.25
+0.82
(+1.56%)
USD |
NASDAQ |
Jul 09, 16:00
53.25
0.00 (0.00%)
After-Hours: 20:00
Price Chart
Key Stats
| Price and Performance | |
|---|---|
| Market Cap | 1.699B |
| 52 Week High (Daily) | |
| 52 Week Low (Daily) | |
| All-Time High (Daily) | |
| Year to Date Total Returns (Daily) | |
| 1 Month Total Returns (Daily) | |
| 1 Year Total Returns (Daily) | 28.07% |
| Valuation | |
| PE Ratio | 13.49 |
| PE Ratio (Forward) | |
| PS Ratio | 3.202 |
| Price to Book Value | 1.283 |
| EV to EBITDA | |
| Dividend | |
|---|---|
| Dividend | 0.36 |
| Dividend Yield (Forward) | |
| Financials | |
| Revenue (5 Year Growth) | |
| Revenue (Quarterly YoY Growth) | |
| EPS Diluted (5 Year Growth) | |
| EPS Diluted (Quarterly YoY Growth) | |
| Debt to Equity Ratio | 0.0598 |
| Return on Equity | |
| Return on Assets | |
| Risk | |
| Beta (5Y) | |
| Max Drawdown (5Y) | 48.84% |
Profile
| TriCo Bancshares is a bank holding company, which engages in the provision of banking services to retail customers and small to medium-sized businesses. It offers personal and business accounts, personal and business loans and credit, and personal and business services. The company was founded on October 13, 1981 and is headquartered in Chico, CA. |
| URL | http://www.tcbk.com |
| Investor Relations URL | https://www.tcbk.com/about/investor-relations |
| HQ State/Province | California |
| Sector | Financials |
| Industry | Banks |
| Equity Style | Small Cap Core |
| Next Earnings Release | Jul. 23, 2026 (est.) |
| Last Earnings Release | Apr. 23, 2026 |
| Next Ex-Dividend Date | N/A |
| Last Ex-Dividend Date | Jun. 05, 2026 |