

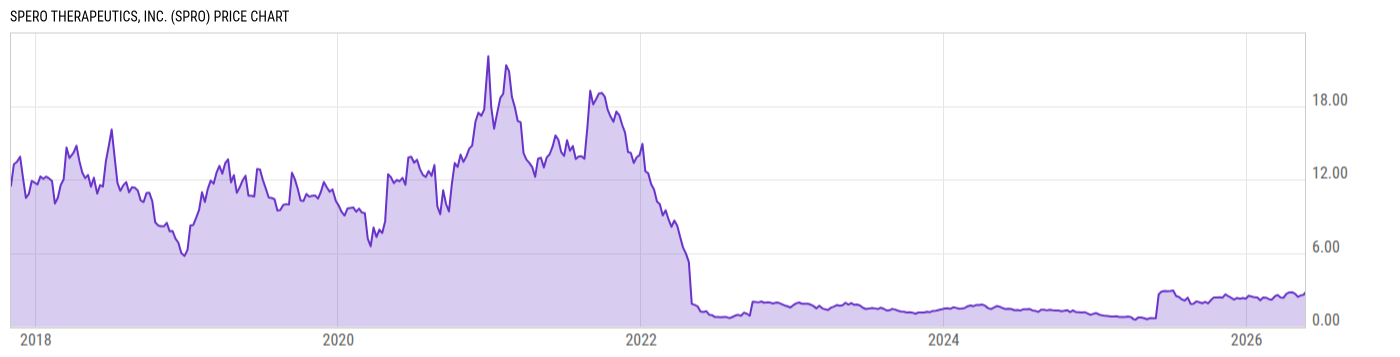
Spero Therapeutics, Inc. (SPRO)
2.635
-0.10
(-3.83%)
USD |
NASDAQ |
Jun 09, 13:44
Price Chart
Key Stats
| Price and Performance | |
|---|---|
| Market Cap | 152.54M |
| 52 Week High (Daily) | |
| 52 Week Low (Daily) | |
| All-Time High (Daily) | |
| Year to Date Total Returns (Daily) | |
| 1 Month Total Returns (Daily) | |
| 1 Year Total Returns (Daily) | 9.60% |
| Valuation | |
| PE Ratio | 10.82 |
| PE Ratio (Forward) | |
| PS Ratio | 2.754 |
| Price to Book Value | 2.882 |
| EV to EBITDA | |
| Dividend | |
|---|---|
| Dividend | -- |
| Dividend Yield (Forward) | |
| Financials | |
| Revenue (5 Year Growth) | |
| Revenue (Quarterly YoY Growth) | |
| EPS Diluted (5 Year Growth) | |
| EPS Diluted (Quarterly YoY Growth) | |
| Debt to Equity Ratio | 0.0467 |
| Return on Equity | |
| Return on Assets | |
| Risk | |
| Beta (5Y) | |
| Max Drawdown (5Y) | 97.46% |
Profile
| Spero Therapeutics, Inc. is a clinical-stage biopharmaceutical company, which focuses on identifying, developing, and commercializing treatments involving bacterial infections, including multi-drug resistant bacterial infections, and rare diseases Its pipeline product candidates include Tebipenem HBr, SPR720, and SPR206. The company was founded by Ankit A. Mahadevia and Laurence Rahme in April 2013 and is headquartered in Cambridge, MA. |
| URL | http://www.sperotherapeutics.com |
| Investor Relations URL | https://investors.sperotherapeutics.com/ |
| HQ State/Province | Massachusetts |
| Sector | Health Care |
| Industry | Biotechnology |
| Next Earnings Release | Aug. 11, 2026 (est.) |
| Last Earnings Release | May. 13, 2026 |
| Next Ex-Dividend Date | N/A |
| Last Ex-Dividend Date | N/A |