

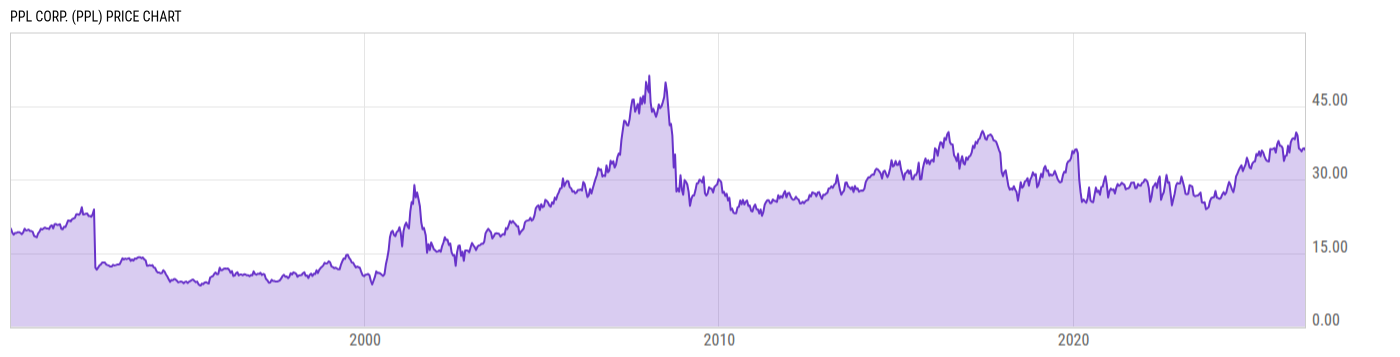
PPL Corp. (PPL)
36.10
+0.03
(+0.08%)
USD |
NYSE |
Jul 14, 16:00
36.10
0.00 (0.00%)
Pre-Market: 20:00
Price Chart
Key Stats
| Price and Performance | |
|---|---|
| Market Cap | 27.15B |
| 52 Week High (Daily) | |
| 52 Week Low (Daily) | |
| All-Time High (Daily) | |
| Year to Date Total Returns (Daily) | |
| 1 Month Total Returns (Daily) | |
| 1 Year Total Returns (Daily) | 7.15% |
| Valuation | |
| PE Ratio | 22.20 |
| PE Ratio (Forward) | |
| PS Ratio | 2.897 |
| Price to Book Value | 1.808 |
| EV to EBITDA | |
| Dividend | |
|---|---|
| Dividend | 0.285 |
| Dividend Yield (Forward) | |
| Financials | |
| Revenue (5 Year Growth) | |
| Revenue (Quarterly YoY Growth) | |
| EPS Diluted (5 Year Growth) | |
| EPS Diluted (Quarterly YoY Growth) | |
| Debt to Equity Ratio | 1.348 |
| Return on Equity | |
| Return on Assets | |
| Risk | |
| Beta (5Y) | |
| Max Drawdown (5Y) | 26.92% |
Profile
| PPL Corp. engages in the generation, transmission and distribution of electricity. It operates through the following segments: Kentucky Regulated, Pennsylvania Regulated, and Rhode Island Regulated. The Kentucky Regulated segment consists of LKE's regulated electricity generation, transmission and distribution operations of Louisville Gas and Electric Company and Kentucky Utilities Company as well as regulated distribution and sale of natural gas of Louisville Gas and Electric Company. The Rhode Island Regulated segment primarily consists of regulated electricity transmission and distribution operations and regulated distribution and sale of natural gas conducted by RIE. The Pennsylvania Regulated segment consists of the regulated electricity transmission and distribution operations of PPL Electric Utilities Corporation. The company was founded on June 4, 1920 and is headquartered in Allentown, PA. |
| URL | http://www.pplweb.com |
| Investor Relations URL | https://investors.pplweb.com/ |
| HQ State/Province | Pennsylvania |
| Sector | Utilities |
| Industry | Electric Utilities |
| Equity Style | Mid Cap Value |
| Next Earnings Release | Jul. 30, 2026 (est.) |
| Last Earnings Release | May. 08, 2026 |
| Next Ex-Dividend Date | N/A |
| Last Ex-Dividend Date | Jun. 10, 2026 |