

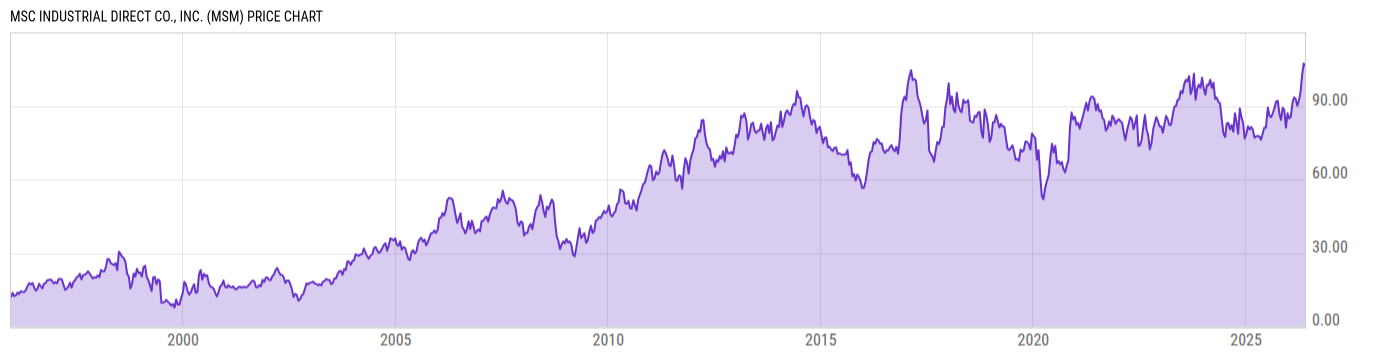
MSC Industrial Direct Co., Inc. (MSM)
115.51
-1.47
(-1.26%)
USD |
NYSE |
Jun 05, 16:00
115.51
0.00 (0.00%)
After-Hours: 20:00
Price Chart
Key Stats
| Price and Performance | |
|---|---|
| Market Cap | 6.449B |
| 52 Week High (Daily) | |
| 52 Week Low (Daily) | |
| All-Time High (Daily) | |
| Year to Date Total Returns (Daily) | |
| 1 Month Total Returns (Daily) | |
| 1 Year Total Returns (Daily) | 49.07% |
| Valuation | |
| PE Ratio | 31.08 |
| PE Ratio (Forward) | |
| PS Ratio | 1.684 |
| Price to Book Value | 4.661 |
| EV to EBITDA | |
| Dividend | |
|---|---|
| Dividend | 0.87 |
| Dividend Yield (Forward) | |
| Financials | |
| Revenue (5 Year Growth) | |
| Revenue (Quarterly YoY Growth) | |
| EPS Diluted (5 Year Growth) | |
| EPS Diluted (Quarterly YoY Growth) | |
| Debt to Equity Ratio | 0.4038 |
| Return on Equity | |
| Return on Assets | |
| Risk | |
| Beta (5Y) | |
| Max Drawdown (5Y) | 29.28% |
Profile
| MSC Industrial Direct Co., Inc. engages in the distribution of metalworking and maintenance, repair, and operations products and services. Its products include cutting tools, measuring instruments, tooling components, metalworking products, fasteners, flat stock, raw materials, abrasives, machinery hand and power tools, safety and janitorial supplies, plumbing supplies, materials handling products, power transmission components and electrical supplies. The company was founded by Sidney Jacobson in 1941 and is headquartered in Melville, NY. |
| URL | http://www.mscdirect.com |
| Investor Relations URL | https://investor.mscdirect.com/ |
| HQ State/Province | New York |
| Sector | Industrials |
| Industry | Trading Companies & Distributors |
| Next Earnings Release | Jul. 01, 2026 |
| Last Earnings Release | Apr. 01, 2026 |
| Next Ex-Dividend Date | N/A |
| Last Ex-Dividend Date | Apr. 08, 2026 |