

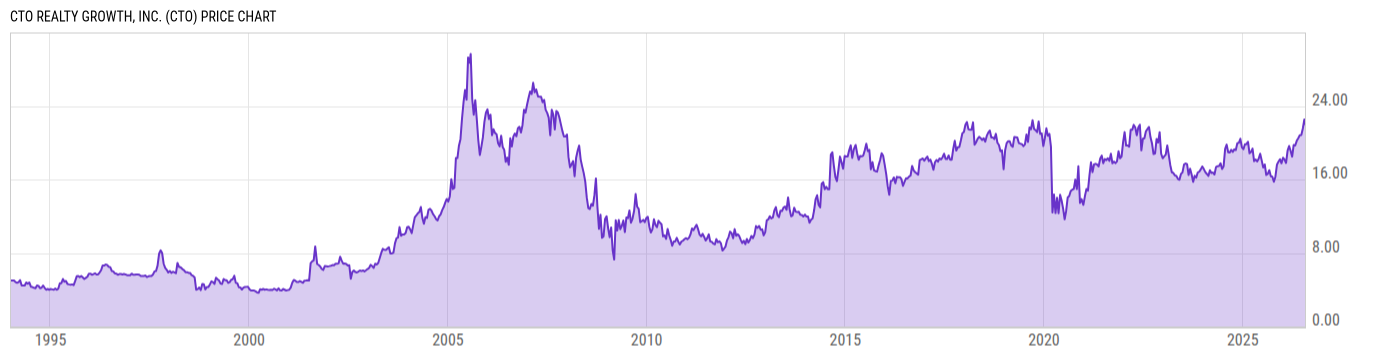
CTO Realty Growth, Inc. (CTO)
22.03
+0.03
(+0.14%)
USD |
NYSE |
Jul 27, 16:00
22.06
+0.03
(+0.14%)
Pre-Market: 20:00
Price Chart
Key Stats
| Price and Performance | |
|---|---|
| Market Cap | 733.46M |
| 52 Week High (Daily) | |
| 52 Week Low (Daily) | |
| All-Time High (Daily) | |
| Year to Date Total Returns (Daily) | |
| 1 Month Total Returns (Daily) | |
| 1 Year Total Returns (Daily) | 35.48% |
| Valuation | |
| PE Ratio | 104.26 |
| PE Ratio (Forward) | |
| PS Ratio | 4.626 |
| Price to Book Value | 1.275 |
| EV to EBITDA | |
| Dividend | |
|---|---|
| Dividend | 0.38 |
| Dividend Yield (Forward) | |
| Financials | |
| Revenue (5 Year Growth) | |
| Revenue (Quarterly YoY Growth) | |
| EPS Diluted (5 Year Growth) | |
| EPS Diluted (Quarterly YoY Growth) | |
| Debt to Equity Ratio | 1.186 |
| Return on Equity | |
| Return on Assets | |
| Risk | |
| Beta (5Y) | |
| Max Drawdown (5Y) | 25.46% |
Profile
| CTO Realty Growth, Inc. operates as a real estate company. It owns and manages commercial real estate properties. It operates through the following segments: Income Properties, Management Services, Commercial Loans and Investments, and Real Estate Operations. The company was founded in 1910 and is headquartered in Winter Park, FL. |
| URL | http://www.ctoreit.com |
| Investor Relations URL | https://ir.ctlc.com/ |
| HQ State/Province | Florida |
| Sector | Real Estate |
| Industry | Diversified REITs |
| Equity Style | Small Cap Value |
| Next Earnings Release | Jul. 28, 2026 |
| Last Earnings Release | Jul. 28, 2026 |
| Next Ex-Dividend Date | N/A |
| Last Ex-Dividend Date | Jun. 11, 2026 |